# Ali Naderi: full text of alinaderiparizi.com
> Every page and post on the site, as Markdown. Index: https://alinaderiparizi.com/llms.txt. Writing is CC BY-SA 4.0 (credit Ali Naderi, link back); code is GPL-3.0.
---
## About
Born in Pariz, a village high in the mountains. My father was a mechanic; today he grows pistachios on our family's land. I still love that land: farming, gardening, hands in the dirt.
---
## Experience
### Chief Technology Officer (AI) (2025 – now)
SciNext · Tehran
Technical lead of an early-stage AI company. I own the systems end to end: architecture, infrastructure, the AI products on top, and the engineering practice around them.
- Designed and built the company's production platform on my own, in about a month: self-service GitOps on Kubernetes (k3s) with Argo CD, Gitea Actions and a private container registry. A push to main is built and rolled out with no manual step; new services onboard themselves from a template.
- Made observability and isolation part of the platform, not per-app work: Prometheus, Grafana, Loki and Tempo for every service; a write-only CI identity for secrets; per-organization namespaces and RBAC; per-application database and object-storage credentials.
- Turn a business problem into a working system: the products range from a Persian-first chemical compound database with a RAG assistant to data-extraction pipelines and developer tooling, each taken from idea to production.
- Build with AI as part of the engineering loop. I set the architecture and the constraints, AI agents do the volume, and I review, test and own what ships. One engineer covers ground that used to need a team.
- The platform runs the company's production services across 5 project organizations. A newly acquired GPU cluster is being brought onto it for training and inference.
- Technical evaluation and mentorship for early-stage AI startups.
Tags: Kubernetes, Argo CD, GitOps, Gitea Actions, Prometheus, Grafana, Loki, Tempo, PostgreSQL, MinIO
Case study: https://alinaderiparizi.com/blog/devops/infrastructure/self-hosting/2026/10/06/running-a-startup-on-one-server.html
### Backend Software Engineer (2026)
Symmio · DeFi protocol · Remote · https://symm.io
- Improved the behaviour of the platform's microservices: reliability and performance under real load.
- Worked on the anomaly detection stack, built on performance metrics and observability tooling, to catch misbehaving services before users do.
Tags: Microservices, Anomaly detection, Observability
### Software Engineer (AI) (2024 – 2025)
CyberDesign Nordic AB · Stockholm, Sweden
Indoor positioning from mobile sensor data.
- Built the machine learning systems that estimate indoor position from mobile sensor data.
- Built the backend APIs and data pipelines behind model training and deployment.
Tags: Python, PyTorch, Sensor data, APIs
### Software Engineer, then engineering lead (2022 – 2024)
IDmelon Technologies · Vancouver, Canada · https://idmelon.com
Passwordless authentication built on the FIDO2 standard. IDmelon later joined HID.
- Worked on the product from its earliest stage: did the initial R&D, built and demonstrated the prototypes, built the first production version, then kept improving it in production.
- Designed and built Windows sign-in with FIDO2 security keys for local accounts, which Windows then supported only for business accounts: a C++ credential provider, a background authentication service and a local FIDO server. The first working version took about a week.
- Led the engineering team as the product matured: designed and implemented major components, helped evolve the architecture, trained and mentored junior engineers, and worked with QC to reproduce, diagnose and fix production bugs.
- Designed secure authentication systems and distributed cloud services; system-level development, data processing pipelines and API architecture.
Tags: FIDO2, Passwordless authentication, Windows credential provider, C++, Python
Case study: https://alinaderiparizi.com/blog/authentication/fido2/security/windows/2026/09/28/idmelon-passwordless-authentication.html
### Software Engineer (Backend) (2020 – 2022)
DataWare · Tehran
- Built scalable backend services and microservice architectures for large-scale data processing.
Tags: Microservices, Backend
### R&D Intern → Junior Embedded Engineer (2017 – 2019)
Sico Systems Intelligizer · Shiraz
Hardware R&D: FPGAs, microcontrollers and embedded Linux.
- Built a DTMF detector in hardware, then a GSM/GPRS device around it: it answers incoming calls, plays voice prompts and takes commands and access codes from the caller's keypad. Chose and integrated the chips and made sure the signal quality held up.
- Evaluated Chinese SoC chipsets and built a Linux-based system-on-board on the Allwinner F1C100S (the Lichee Pi Nano's chip) with analog video input and on-board image processing, such as Laplacian filtering for motion detection.
Tags: FPGA, Microcontrollers, GSM/GPRS, Embedded Linux, Allwinner F1C100S
---
## Research projects
### Persian text-to-speech with single-shot voice cloning (2026)
Generative speech
- Transformer-based TTS that speaks fluent Persian and clones a voice from a single sample.
- Adapted modern neural TTS to Persian: dataset construction, large-scale cleaning, linguistic preprocessing.
- Built the training and fine-tuning pipelines, plus pre- and post-processing that improve pronunciation and fluency.
Tags: Transformers, TTS, Persian
Live demo: https://tts.jome-farmer.ir
### Ez-Crawl: agentic web crawler (2025)
LLM tooling
- LLM-driven crawler that pulls structured data out of raw HTML with prompt-guided extraction.
- Runs on local or cloud LLMs, with automated browsing pipelines.
Tags: LLMs, Agents, Scraping
### TDSC-ABUS2023 PyTorch dataset toolkit (2024)
Open source · medical imaging
- Open-source toolkit for the TDSC 2023 Grand Challenge on 3D automated breast ultrasound.
- Standard loaders, preprocessing and training interfaces for classification and segmentation of volumetric data.
- Published on GitHub and PyPI.
Tags: PyTorch, 3D ultrasound, PyPI
Read the write-up: /blog/abus-classification/medical-imaging/pytorch/python/2026/09/23/tdsc-abus2023-pytorch.html
### Robotic vision for agricultural automation (2020)
Computer vision
- Vision system that finds the optimal cutting point on each saffron flower.
- It became the eyes of a robotic saffron processing machine that cuts the flowers where the model points.
Tags: Computer vision, Robotics
Watch the machine: https://www.youtube.com/watch?v=WaYx6MPUO_E
---
## Teaching
### Teaching assistant, Computer Vision (2022)
IUST · Dr. Mohsen Soryani
- Supervised graduate lab sessions.
- Designed a 3D tumor classification project from the MSc thesis: students built 3D meshes from tumor segmentations and refined them to capture spiculations and narrow protrusions, the surface details that signal malignancy.
### Teaching assistant, Data Structures and Algorithm Design (2017)
Shiraz University · Dr. Korush Zyarati
- Ran quizzes, set and graded homework, designed the midterm and final projects.
### ACM ICPC representative (2016 – 2017)
Shiraz University
- Elected to lead the university's ICPC association: organised contests, taught problem-solving courses, mentored university and high-school competitors.
### Teaching assistant, Competitive Programming (2016)
Shiraz University · Dr. Mohammad Taheri
- Ran problem-solving sessions and coached students for ACM ICPC.
### Instructor, Olympiad in Informatics preparation (2016)
Dastgheyb High School (Sampad) · Shiraz
- Taught high-school students algorithm design and competitive programming for the national and international olympiads.
---
## Education
### MSc, Artificial Intelligence and Robotics (2020 – 2023)
Iran University of Science and Technology (IUST) · Tehran
- Thesis: Classification of human breast cancer lesions in 3D automated breast ultrasound (3D-ABUS) images. Advisors: Dr. Mohsen Soryani, Dr. Ehsan Kozegar.
- Coursework: machine learning, deep learning, computer vision, image processing, stochastic processes.
### BSc, Computer Engineering (2015 – 2020)
Shiraz University
- Project: designed and built a System-on-Board that runs the Linux kernel and processes analog video for embedded vision.
---
## Publications
- Spherical Shape-Based Features for Classification of Breast Tumors in 3D-ABUS Images. A. Naderiparizi, S. Barekat, E. Kozegar, M. Soryani. ongoing work.
- Breast Mass Classification in 3D ABUS based on Laplace-Beltrami Spectra and Dual Path CNN. S. Barekat, A. Naderiparizi, E. Kozegar, M. Soryani. Expert Systems with Applications, 2025. https://doi.org/10.1016/j.eswa.2025.129973
---
## Skills
- ML and research: PyTorch, PyTorch Lightning, HuggingFace Transformers, NumPy, SciPy (used at: 3D-ABUS research, Persian TTS, CyberDesign)
- Backend and APIs: Python, microservices, PostgreSQL, MongoDB (used at: DataWare, IDmelon, CyberDesign, Symmio)
- AI-assisted engineering: LLM agents, RAG, prompt and evaluation design, Claude Code (used at: SciNext products)
- Platform and operations: Kubernetes (k3s), Argo CD, Gitea Actions, Docker, Prometheus, Grafana, Loki, Tempo (used at: SciNext platform)
- Security and authentication: FIDO2, Windows credential providers, Java Card (used at: IDmelon, smart-card series)
- Systems and embedded: C/C++, FPGA, microcontrollers, embedded Linux (used at: Sico Systems, IDmelon)
Also used: Java, C#, TypeScript, Rust, TensorFlow, YOLO, MySQL.
---
# ABUS Classification, Part 3: Laplace–Beltrami, Lesion Shape, and What ‘Malignancy Signal’ Means
- URL: https://alinaderiparizi.com/project/abus-classification/medical-imaging/spectral-geometry/machine-learning/2026/11/03/abus-classification-3-laplace-beltrami.html
- Date: 2026-11-03
- Kind: Project
- Topics: abus-classification, medical-imaging, spectral-geometry, machine-learning
- Code: https://github.com/mralinp/abus-classification
- Summary: From lesion masks to surface eigenvalues: the tested Laplace–Beltrami implementation, the size-confounding investigation, and why a predictive spectrum is not yet an explanation of malignancy.
A surface can be described by the patterns of variation it supports. Laplace–Beltrami eigenvalues turn that idea into numbers, making them candidates for describing the geometry of a segmented breast lesion.
The harder question is what those numbers mean when a classifier predicts malignancy. Is it using irregular shape, lesion size, segmentation artifacts, or some combination?
In [Part 2]({% post_url project/2026-11-03-abus-classification-2-reproducing-results %}), I described the reproduction experiments. This post introduces the spectral mathematics, explains what we have implemented and checked, and follows the evidence that made us question our initial interpretation. It records work at checkout `55859f9`, rather than presenting the planned mathematical research as completed.
# 1. Geometry is evidence, not a diagnosis
A malignant lesion is defined by its pathology. An image-derived measurement can be associated with that label without explaining the underlying biology or being sufficient to diagnose a patient.
The classical experiments give a useful example: coronal spiculation features retain discrimination on TDSC-ABUS, but posterior acoustic behavior does not transfer comparably. An imaging feature’s usefulness depends on how the cohort was collected, how the image was acquired and how the feature was measured. The [original spiculation study](https://pubmed.ncbi.nlm.nih.gov/22271831/) supplies the imaging motivation; our experiments test a particular implementation on a different cohort.
A lesion’s surface offers a complementary representation. Instead of keeping every image intensity, we ask what can be learned from the boundary of its expert-provided mask. That boundary is itself an estimate, affected by image resolution and annotation choices.
# 2. From an image mask to a surface
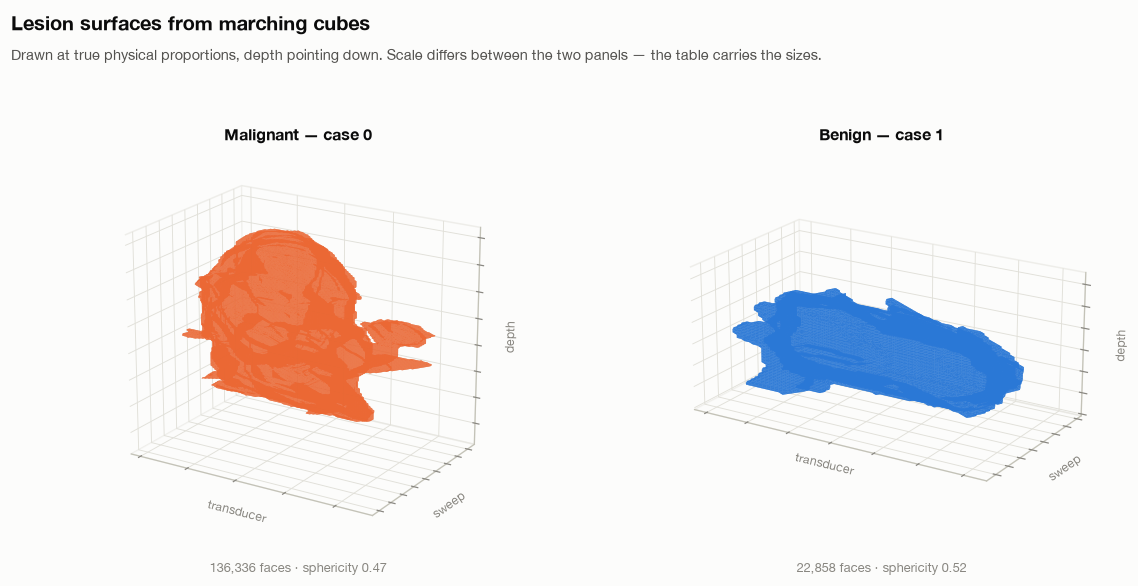
The starting point is a 3D binary array: foreground marks the lesion, background marks everything else. Marching cubes converts its boundary into a triangle mesh. Physical voxel spacing converts array coordinates into millimetres.
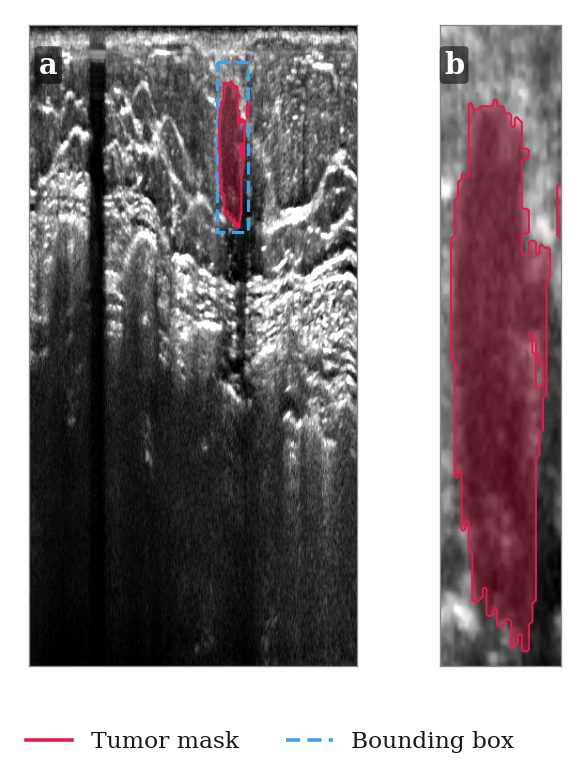
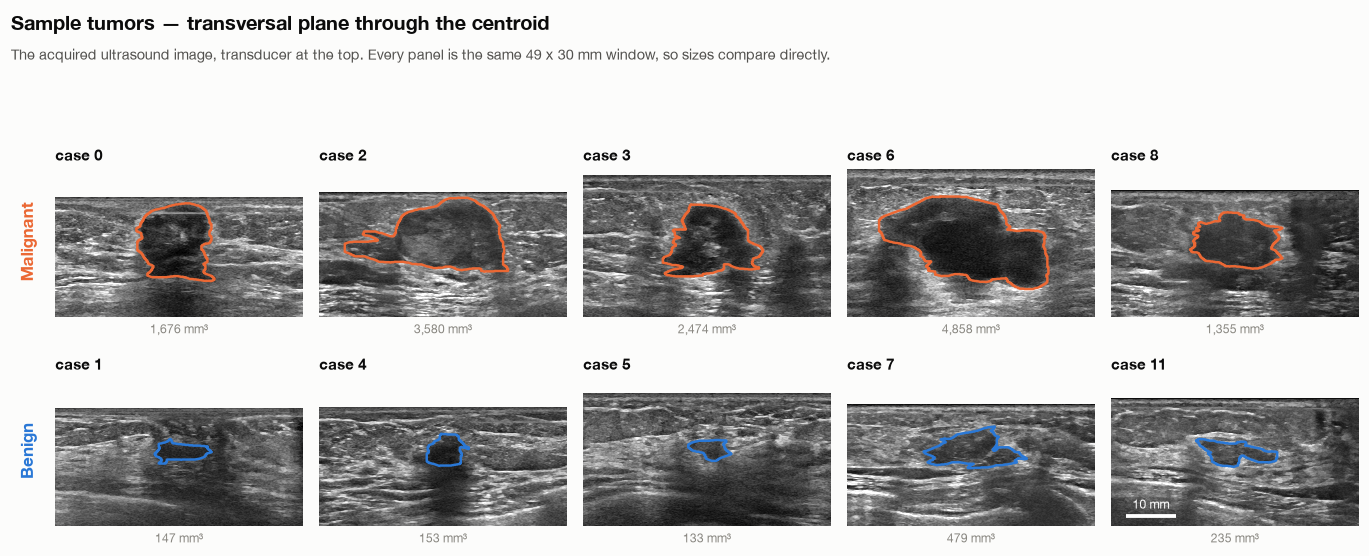
Reconstructed lesion surfaces at physical proportions, with a different plotting scale in each panel. Two examples illustrate the representation; they do not establish a class-level difference.
Meshing was not a neutral preprocessing detail. A tightly cropped mask can touch its array boundary, leaving an open surface. Our `lesion_mesh` helper zero-pads the mask before extraction and translates the vertices back afterward.
The earlier morphological-closing step also damaged thin structures in this dataset. The project records eight open surfaces out of 200 under that path. Disabling that preprocessing and padding the input produced closed surfaces for all 200 in the recorded checks.
Closed does not automatically mean topologically spherical, connected, or free of discretization artifacts. Those conditions need their own checks before applying a theorem that assumes them.
# 3. What is the Laplace–Beltrami operator?
The ordinary Laplacian measures how a function varies relative to its neighborhood. The Laplace–Beltrami operator generalizes that idea to a curved surface, using distances and areas on the surface itself.
With the nonnegative sign convention, its eigenproblem is
$$
-\Delta_S\phi_k = \lambda_k\phi_k.
$$
Here, $S$ is the surface, $\phi_k$ is a pattern over it, and $\lambda_k$ measures the corresponding mode. A vibration or heat-diffusion analogy helps build intuition; these are mathematical modes of the reconstructed surface, not measured vibrations of tissue.
On a connected closed surface, the constant mode has eigenvalue zero. The following eigenvalues summarize progressively finer variations. They provide an intrinsic descriptor: rotating or translating the surface does not change its ideal spectrum. They are not a unique barcode—different geometries can share spectral information, and a finite list loses still more detail.
The [Shape-DNA work](https://reuter.mit.edu/blue/papers/reuter-shapeDNA06/reuter-shapeDNA06.pdf) develops this representation. Its mathematical motivation makes spectral features worth investigating; whether they predict malignancy is a separate empirical question.
# 4. The discrete operator we implemented
On a triangle mesh, our utility builds a cotangent stiffness matrix $L$ and a lumped mass matrix $M$. For an interior edge, the weight is
$$
w_{ij}=\frac{\cot\alpha_{ij}+\cot\beta_{ij}}{2},
$$
where the angles are opposite the edge in its adjacent triangles. The stiffness matrix is $L=D-W$. Each diagonal entry of $M$ contains one third of the total area of the adjacent triangles.
The geometric eigenproblem is then
$$
L\phi_k=\lambda_k M\phi_k.
$$
The mass matrix accounts for the area represented by each vertex. It is not an optional formatting choice: omitting it changes the eigenproblem.
The implementation uses a sparse symmetric solver, with a small negative shift to find low eigenvalues near the singular zero mode. The [source](https://github.com/mralinp/abus-classification/blob/55859f9/abus_classification/features/shape_descriptor/shape_descriptors.py) also implements heat, wave and global-point descriptors. Their presence in the library does not establish validated classification performance.
# 5. A check with a known answer
For the unit sphere, the continuous eigenvalues are $\ell(\ell+1)$, with multiplicity $2\ell+1$:
| Degree | Eigenvalue | Multiplicity |
| --- | ---: | ---: |
| 0 | 0 | 1 |
| 1 | 2 | 3 |
| 2 | 6 | 5 |
The [unit test](https://github.com/mralinp/abus-classification/blob/55859f9/test/utils_tests/features_tests/test_signature.py) constructs a triangulated sphere and checks the first nine values: approximately zero, three values near 2, and five near 6. The nonzero groups have a 5% tolerance.
This checks the sign convention, mass-weighted formulation and low-frequency result against an analytic example. It does not prove convergence on every lesion mesh, robustness to segmentation errors, or a connection to cancer. Each of those needs additional evidence.
# 6. Size is built into the geometric spectrum
If a smooth surface is enlarged by a factor $s$, its geometric eigenvalues scale as
$$
\lambda_k(sS)=s^{-2}\lambda_k(S).
$$
Its area scales as $s^2$. Therefore $\lambda_k A$ is scale-invariant in the ideal geometric formulation; ratios between nonzero eigenvalues also cancel uniform scale.
This matters for interpretation. A raw spectral feature can carry useful information about size. If size is associated with labels in a cohort, a classifier may benefit without learning the size-independent irregularity we hoped to study.
Area normalization changes the question from “what does the raw spectrum predict?” to “what remains when ideal uniform scale is removed?” It does not guarantee that the remaining descriptor is better for classification.
# 7. A crucial distinction in our reproduction
The sphere-tested utility solves the generalized problem above. However, the hybrid reproduction’s [cache builder](https://github.com/mralinp/abus-classification/blob/55859f9/abus_classification/data/lesion_cache.py) currently takes eigenvalues of **$L$ alone**, discarding $M$ to follow its reading of the paper’s equations.
These are different numerical objects. Under uniform scaling of a fixed triangulation, cotangent angles do not change, so $L$ does not change. Its ordinary eigenvalues therefore do **not** obey the geometric $s^{-2}$ law. Across voxel-derived lesions, vertex count, sampling density and geometry vary together, which can still create a strong association with size.
Consequently, multiplying these $L$-only eigenvalues by surface area cannot automatically be interpreted as the theoretically justified normalization of the generalized spectrum. This distinction has to be resolved before attributing a biological meaning to the reproduction features or treating their normalization experiments as a clean test of intrinsic shape.
The sphere test validates the generalized utility. It does not validate the cached $L$-only vector as an equivalent approximation.
# 8. What the exploratory size analysis found
The hybrid notebook records a five-fold development-set logistic-regression comparison on 130 Train + Validation lesions:
| Cached feature transformation | Recorded correlation with lesion volume | Spectral features only, CV AUC | With radiomic features, CV AUC |
| --- | ---: | ---: | ---: |
| Raw log eigenvalues | −0.98 | 0.725 | 0.823 |
| Area-multiplied log values | −0.31 | 0.671 | 0.755 |
| Log ratios to first nonzero eigenvalue | 0.16 | 0.501 | 0.774 |
| Radiomic features only | — | — | 0.761 |
These numbers are recorded in the [notebook discussion](https://github.com/mralinp/abus-classification/blob/55859f9/notebooks/2-barekatrezaei2026.ipynb), rather than a complete saved analysis cell with predictions and fold results. The discussion does not fully specify the correlation summary. They should be treated as exploratory notes pending a reproducible rerun, not as a finished statistical result.
The pattern is nevertheless worth investigating: discrimination falls when transformations reduce the recorded size association. It suggests the current representation may derive substantial predictive information from size or mesh sampling. It does not prove that all spectral information is size, that shape is irrelevant, or that normalization caused the original reproduction gap.
The ablations add another caution. A row called “no LB” only removes spectral features from the tabular branches; the CNN still receives them. It cannot settle the contribution of spectral features to the entire system.
# 9. What would establish a stronger interpretation?
The next experiments need to distinguish three sources of information: **physical size, intrinsic shape, and discretization**.
A defensible sequence is to compare the generalized and $L$-only spectra on the same meshes; vary mesh resolution while holding the surface fixed; scale the same mesh without remeshing; and test controlled shape changes at matched size. On lesions, we then need volume-only, shape-only and combined baselines with all preprocessing fitted inside folds.
Segmentation perturbations and predicted masks are also essential. A descriptor that depends on tiny expert-drawn boundary details may not survive an automatic segmentation pipeline. Repeated inspection of the official Test set during ablation work means final selection needs fresh validation rather than the best observed Test row.
The roadmap also includes spectral geometry results about area, curvature and genus-zero surfaces, and a relationship with spherical harmonics. Those are directions to study and verify under their assumptions. They are not completed malignancy explanations.
# 10. What this work means so far
We have a surface-construction pipeline, a generalized operator with an analytic sphere check, hybrid-model reproduction results, and an exploratory warning that the current spectral features may carry substantial size or sampling information.
That is evidence of progress, including a reason to revise the interpretation. The original goal was to understand what the spectrum contributes. Discovering that a predictive vector may answer a different question is part of that work.
At this stage, “malignancy signal” means an association between a computed measurement and the labels in this dataset. Turning that into a stable shape descriptor, a mechanistic explanation, or a clinically useful tool requires further experiments. The next step is to make those alternatives distinguishable.
---
# ABUS Classification, Part 2: Reproducing Results—and Reporting What Did Not Reproduce
- URL: https://alinaderiparizi.com/project/abus-classification/medical-imaging/reproducibility/machine-learning/2026/11/03/abus-classification-2-reproducing-results.html
- Date: 2026-11-03
- Kind: Project
- Topics: abus-classification, medical-imaging, reproducibility, machine-learning
- Code: https://github.com/mralinp/abus-classification
- Summary: Reimplementing classical ABUS classifiers and our published hybrid model: the held-out results, seed variation, ablations, and unresolved differences that make reproduction useful.
In [Part 1]({% post_url project/2026-09-16-abus-classification-1-imaging-modalities %}), I introduced automated 3D breast ultrasound and why its full volumes are useful for studying breast lesions. This post starts where that background ends: implementing published methods, checking their behavior, and comparing their results on a shared dataset.
The work has two outcomes so far. Classical coronal-spiculation features transfer reasonably well to TDSC-ABUS. Our reimplementation of the published Laplace–Beltrami/dual-path CNN system produces useful predictions, but **does not reproduce its reported stacking result**. Both belong in the research record.
This is ongoing work by Ali Naderiparizi and Sepideh Barekatrezaei at the Iran Image Processing Lab, under the supervision of Dr. Ehsan Kozegar and Dr. Mohsen Soryani. The [repository](https://github.com/mralinp/abus-classification) holds the implementations, notebooks and stored result tables. The account below follows local checkout `55859f9`.
# 1. What does “reproduce” mean here?
There are two different exercises in this project:
- **Transfer a published method to another dataset.** We implement Tan and colleagues’ 2012 and 2013 feature-based classifiers on TDSC-ABUS. Their original cohorts, segmentation and validation procedures differ, so matching their exact headline number is not the criterion for success.
- **Reimplement our published hybrid system from its description.** We compare its reported Table 3 with fresh runs and investigate discrepancies. Comparing this implementation with the original author code remains unfinished.
A classifier that produces a plausible AUC is not automatically a faithful implementation. Feature definitions, preprocessing, data splits and the training procedure all need checking.
# 2. Establishing the data and protocol
TDSC-ABUS contains 200 annotated volumes. The official split is:
| Split | Lesions | Malignant | Benign |
| --- | ---: | ---: | ---: |
| Train | 100 | 58 | 42 |
| Validation | 30 | 17 | 13 |
| Test | 70 | 40 | 30 |
Our held-out experiments use Train + Validation for development and training, and report on the 70 official Test lesions. The dataset encodes malignant as `0`; the shared evaluation protocol explicitly converts malignant to the positive class. That conversion matters for sensitivity, probability direction and ROC AUC.
AUC measures ranking across thresholds: roughly, how often a malignant lesion receives a higher score than a benign one. Accuracy measures decisions at a particular threshold. Always predicting malignant already gives 57.1% accuracy on this Test split, so accuracy alone is an inadequate summary.
These experiments use **ground-truth lesion masks**. That isolates classification given a lesion delineation. It does not measure a complete automatic system that must first find and segment the lesion, and it prevents a direct leaderboard comparison with challenge entries doing that harder task. The [challenge paper](https://arxiv.org/abs/2501.15588) describes the broader benchmark.
# 3. Physical dimensions before feature extraction
The image arrays have anisotropic voxels: approximately **0.200 × 0.073 × 0.475674 mm**. Treating one array step as the same physical distance in every direction distorts the lesion and its surrounding tissue.
The Tan implementation uses the documented spacing, identifies axis 1 as ultrasound depth, and resamples the feature-extraction region to 0.6 mm cubic voxels. This is needed because the feature definitions include distances in millimetres: border shells, posterior regions and the neighborhood used to measure spiculation.
It also needs tissue outside the lesion’s bounding box. Cropping tightly around the tumor before computing these features would remove part of the signal we are trying to measure.
# 4. Reproducing the classical features
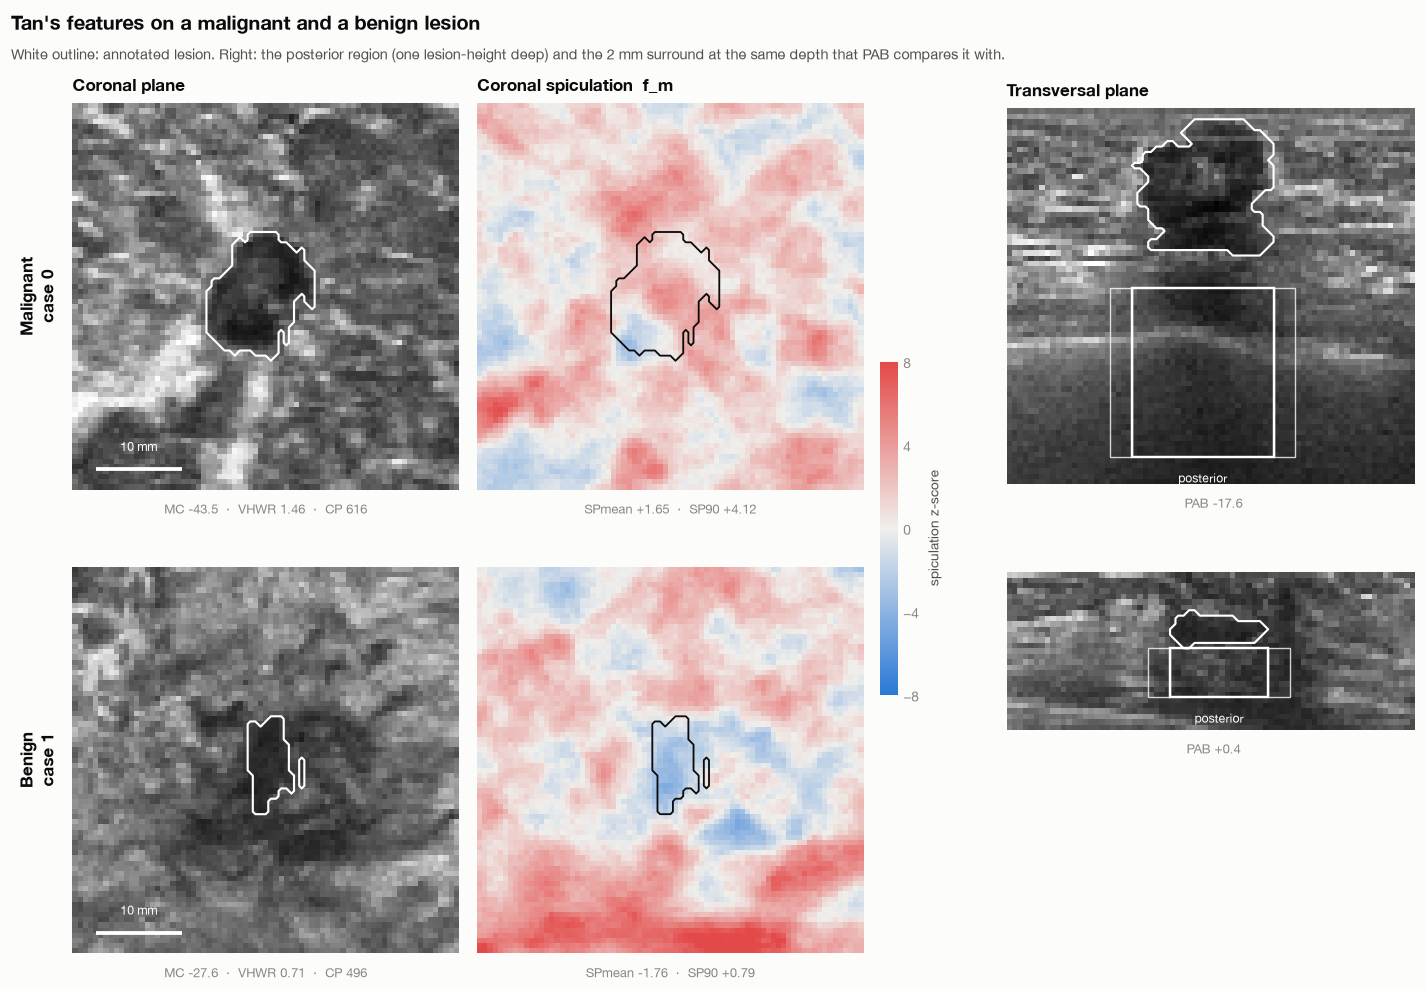
Tan et al. measure **coronal spiculation**: line-like patterns converging toward a lesion in coronal ABUS planes. Their method estimates local line orientations and asks whether more lines point toward a candidate location than chance would predict. The resulting feature is a quantitative description of that pattern, not a visual judgment supplied to the classifier.
Other features describe intensity, margin contrast, shape and posterior acoustic behavior. The [2012 paper](https://pubmed.ncbi.nlm.nih.gov/22271831/) introduces the coronal-spiculation classifier; our notebook records the implementation choices needed to transfer it to this dataset.
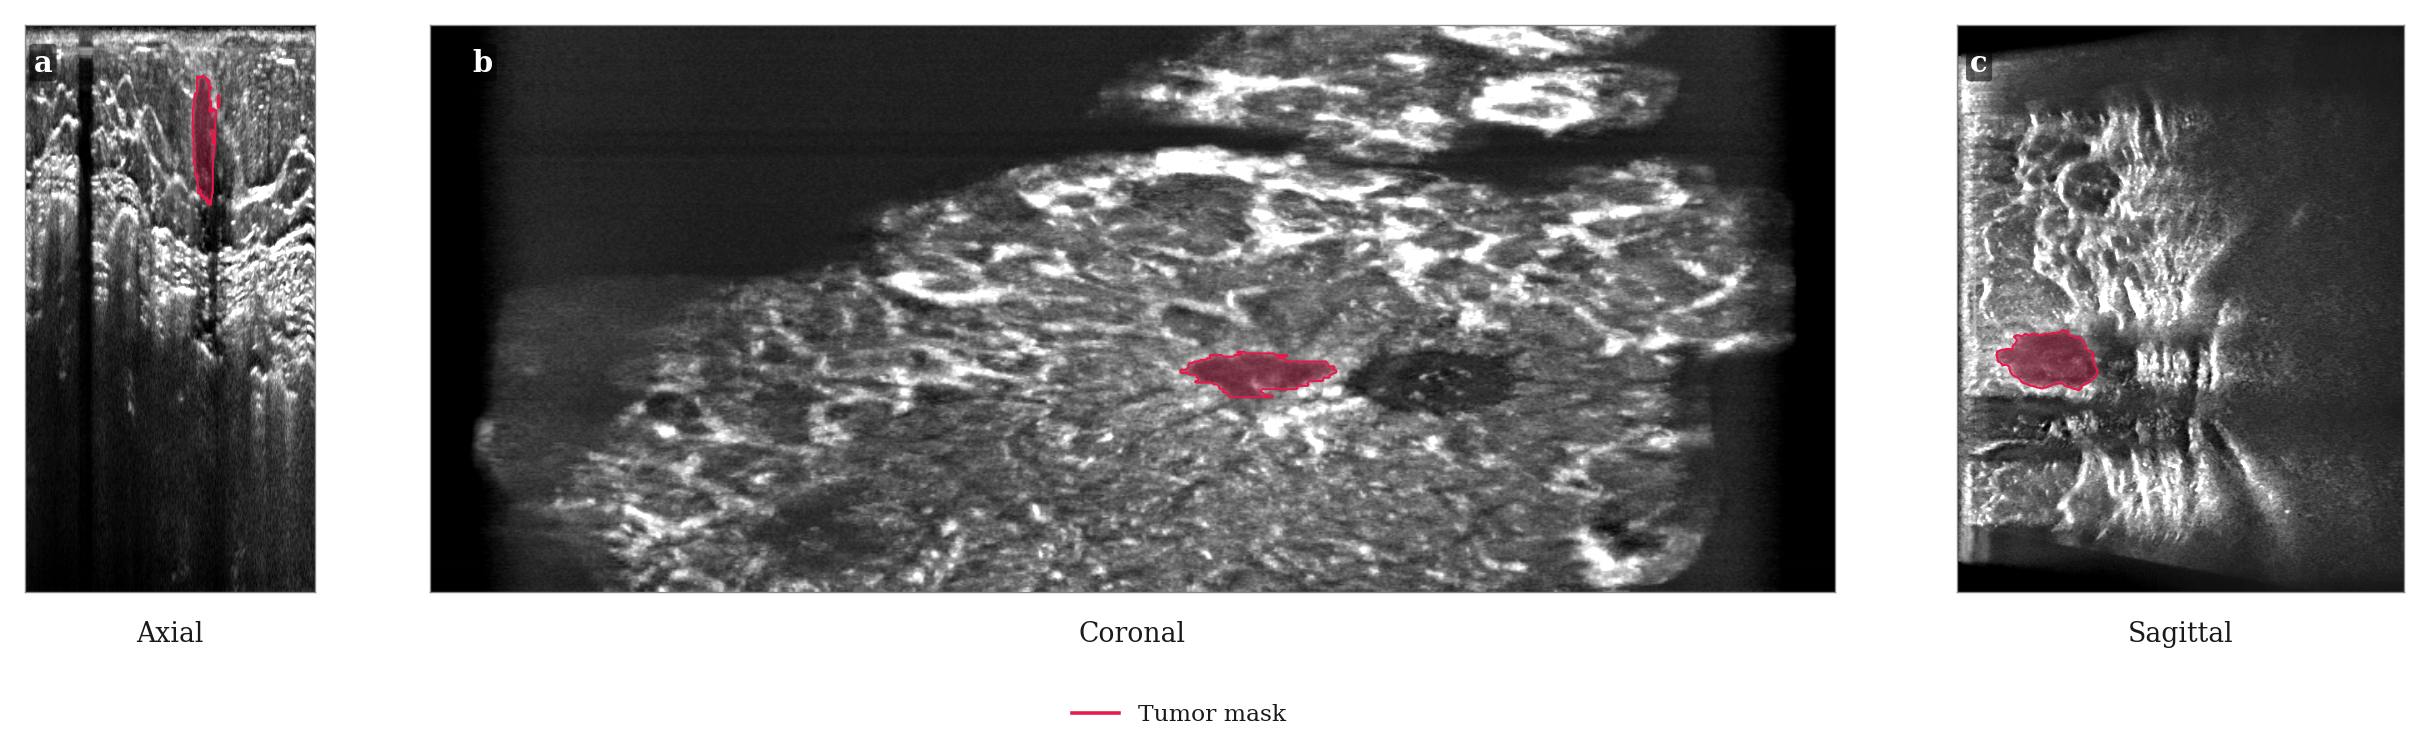
Intermediate outputs from the project: inspecting the selected planes, spiculation response and posterior regions helps check what the feature code is measuring.
The [Tan notebook](https://github.com/mralinp/abus-classification/blob/55859f9/notebooks/1-tao2013.ipynb) documents differences from the original work. We use expert masks rather than the original automatic segmentation, omit an intensity normalization that needs breast-tissue segmentation, and specify missing detector parameters. A moment-matched ellipsoid approximates the 2013 sphere-registration step. Patient identifiers are unavailable, so lesion-level folds cannot establish patient-independent validation.
For the classical cross-validation experiments, scaling, imputation and SVM tuning happen inside the training folds. Repeated cross-validation over all 200 lesions and evaluation on the official Test split are separate estimates; the former includes lesions from the official Test set in its rotating folds.
# 5. What transferred?
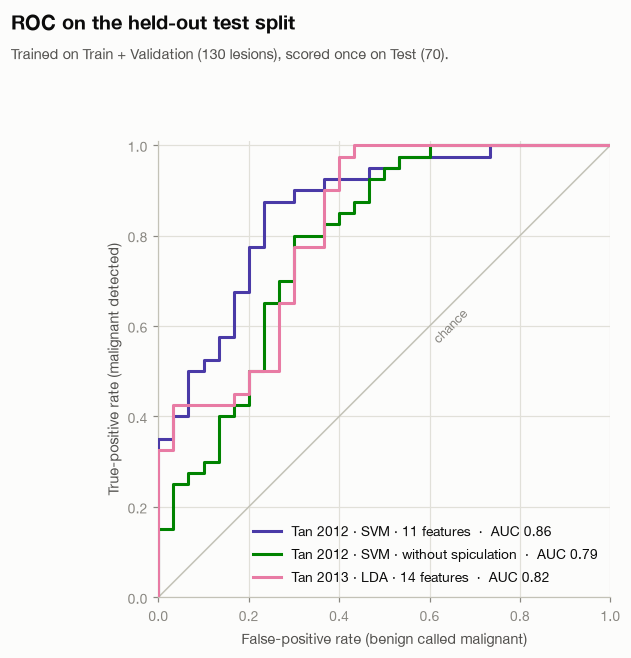
| Method | Official Test AUC | Test accuracy |
| --- | ---: | ---: |
| Tan 2012, 11-feature RBF SVM | 0.86 | 78.6% |
| Same system without spiculation features | 0.79 | 75.7% |
| Tan 2013, 14-feature LDA | 0.82 | 72.9% |
The notebook reports a bootstrap 95% interval of **0.77–0.94** for the 2012 SVM’s Test AUC. That wide interval is part of the result: 70 lesions do not support very precise performance claims.
The held-out ROC curves. These are classification results with ground-truth masks, not end-to-end lesion detection results.
The most informative finding is not simply 0.86. Individual spiculation features reach AUC 0.80–0.81, and removing them reduces the SVM’s Test AUC by 0.07. The notebook also compares spiculation with lesion volume: the combined predictor performs better in cross-validation than either alone. That supports an association beyond size in this experiment, without proving a biological mechanism.
Other features transfer poorly. Posterior acoustic behavior is near chance here, while height-to-width ratio and margin contrast lose much of their reported discrimination. Differences in cohort composition, intensity processing and segmentation are possible explanations. These experiments do not isolate which explanation is responsible.
# 6. Reimplementing the hybrid model
The next implementation follows our [published hybrid classification paper](https://doi.org/10.1016/j.eswa.2025.129973). It combines an SVM, Extra Trees and a dual-path CNN, using radiomic features, a spectral feature vector and lesion-centered image/mask patches.
The current pipeline generates five-fold out-of-fold predictions on the 130 development lesions. A stacker learns from those predictions; Test predictions from the five base-model folds are averaged. We also evaluate simple probability voting and, in seeds 1 and 2, a logistic-regression stacker.
The [stored CSV files](https://github.com/mralinp/abus-classification/tree/55859f9/results/eswa2025) give the following Test AUCs:
| Model | Published Table 3, as transcribed in notebook | Seed 0 | Seed 1 | Seed 2 |
| --- | ---: | ---: | ---: | ---: |
| SVM | 0.8233 | 0.7667 | 0.7767 | 0.7767 |
| Extra Trees | 0.7771 | 0.8125 | 0.8108 | 0.8088 |
| CNN | 0.7867 | 0.8600 | 0.8283 | 0.8708 |
| Voting | 0.8725 | 0.8625 | 0.8517 | 0.8633 |
| Stacking / current HGB stacker | 0.9350 | 0.7546 | 0.6787 | 0.7383 |
| Current logistic-regression stacker | — | — | 0.8242 | 0.8225 |
“Current HGB stacker” names our implementation; it does not establish that every choice matches the original code. The CNN sometimes exceeds the paper’s corresponding row, voting is fairly close, and stacking falls substantially short. Reporting only the favorable CNN result would misrepresent the reproduction.
The seed runs measure some training variability. They do not represent three independent test cohorts, and their spread is not a confidence interval for generalization.
# 7. Ablations, and the limits of their interpretation
The saved seed-0 ablations vary dimensionality reduction, feature dimensions, feature groups and ensemble members. They do not recover the published preference for the same Isomap configuration or a clear benefit from spectral features in every setting.
There is an important implementation detail in the row named `T7 no LB`: it removes spectral features from the **tabular branches**, while the reused CNN still receives them. It must not be described as removing Laplace–Beltrami features from the whole system. Likewise, `T8 CNN none` removes the CNN’s auxiliary vector while the tabular branches retain theirs.
These are useful comparisons, but the labels alone are insufficient to interpret them. Because many variants have now been scored on the official Test set, choosing the best row afterward would make that set part of model selection. Any final claim needs a fixed protocol and fresh validation.
There is also more protocol cleanup to do: spectral standardization currently fits on all Train + Validation rows before the inner folds. It excludes official Test data, but held-out fold covariates influence preprocessing. Fitting the scaler inside each fold is needed for strictly separated out-of-fold predictions. This post records existing results; it does not silently repair their provenance.
# 8. What we can claim today
We have implemented and exercised classical feature-based methods, stored multi-seed runs of the hybrid reimplementation, and investigated cases where the expected advantage disappears. We have not established an exact reproduction of the original hybrid result, completed the original-code comparison, or clinically validated a diagnostic system.
The unresolved gap is a research question. Candidate causes include feature construction, mesh discretization, preprocessing and training details. The next post follows one of those questions: **does the spectral vector capture lesion shape, lesion size, or properties of the mesh?**
Continue to [Part 3: Laplace–Beltrami, Lesion Shape, and What “Malignancy Signal” Means]({% post_url project/2026-11-03-abus-classification-3-laplace-beltrami %}).
---
# ZLT X28: Bringing OpenWrt to a Locked-Down 5G Router
- URL: https://alinaderiparizi.com/blog/embedded/network/openwrt/2026/11/03/zlt-x28-openwrt.html
- Date: 2026-11-03
- Kind: Blog post
- Topics: embedded, network, openwrt
- Code: https://github.com/mralinp/zlt-x28-openwrt
- Summary: A walkthrough of bringing OpenWrt to the ZLT X28: Telnet and SSH access, repairing LuCI, reverse engineering boot binaries, finding the UART, proving recovery, and running 5G, WireGuard and Passwall2.
My ZLT X28 now boots an OpenWrt 23.05.5 userspace, brings up its 5G connection through netifd, and runs WireGuard and Passwall2. It still uses the vendor's Linux 4.19.205 kernel and proprietary modem stack. On a local benchmark, WireGuard reached 715 Mbit/s sending from the router, with CPU headroom left.
This walkthrough follows how the project developed: first getting inside the stock system through Telnet and SSH, then repairing LuCI, identifying the serial console, backing up the flash, reverse engineering the boot binaries, and building a native OpenWrt system. Along the way, it introduces the pieces that make an embedded Linux router work. This became one of the most satisfying systems engineering projects I have worked on: hardware, firmware and networking all meeting in one box.
The code and engineering record are in [zlt-x28-openwrt](https://github.com/mralinp/zlt-x28-openwrt). The firmware results below describe release `v0.37.0` as recorded on November 2, 2026; the UART wiring follows the repository’s later corrected pinout. It is a beta tested on **one unit, one SIM and one carrier**.
# 1. Why replace the firmware?
The X28 is a 5G CPE built around MediaTek's MT6890/T750 platform and Quectel's RG500L modem platform. It ships with a vendor-customized OpenWrt 19.07 system and a vendor web interface.
I wanted the hardware to behave like a normal OpenWrt router: configure interfaces in LuCI, keep settings in UCI, let netifd manage network lifecycles, and run VPN and proxy tools through the standard networking stack. I also wanted to keep the working modem and board-specific calibration.
There was useful prior work. [EngineerMazeed/ZLT-X28](https://github.com/EngineerMazeed/ZLT-X28) brought LuCI onto the stock firmware, and [gaglians/zlt-x28-openwrt2305](https://github.com/gaglians/zlt-x28-openwrt2305) explored a newer userspace on the vendor kernel. The [MT6890 recovery project](https://github.com/mt6890-cpe-recovery/mt6890-cpe-recovery) and [mtkclient](https://github.com/bkerler/mtkclient) provided essential recovery foundations.
My target was an integrated system where OpenWrt owns network policy and the vendor components provide the hardware backend. That distinction shaped almost every decision afterward.
# 2. Getting inside: Telnet, then SSH
The first phase happened on the original firmware. We began with a Telnet foothold on the unlocked test unit. Telnet gave us a shell inside the box, where we could inspect the running Linux system instead of relying on the vendor web interface.
Telnet carries its session without encryption. For continued work, we moved to **Dropbear**, the lightweight SSH server commonly used on embedded systems, with public-key authentication. In this stock-firmware phase it listened on the LAN address at port **2222**. Later, the native image moved SSH to the usual port **22**.
The preserved access scripts show how we bootstrapped that SSH service: an authenticated request to the vendor web backend used a command-injection path in its DMZ setting handler to execute a shell command. One script installed an already staged public key into Dropbear’s `authorized_keys`; another started Dropbear bound to the LAN address, with password authentication and forwarding disabled. Both attempted to restore the temporary DMZ setting afterward. That restoration was cleanup, not a general transaction or guaranteed rollback.
This was access to our own device. The public early narrative stops at the Telnet foothold, so it does not provide a complete Telnet-unlock recipe. The important transition for the project was from temporary access to repeatable, authenticated SSH access, and then making that service survive reboot.
Once inside, a few read-only commands established the baseline:
```sh
# Historical stock-firmware SSH endpoint; the native image uses port 22.
ssh -p 2222 root@192.168.70.1
uname -a
cat /etc/openwrt_release
cat /proc/cmdline
cat /proc/mtd
ps w
```
These answer different questions: which kernel is running, which OpenWrt base the vendor used, which slot Linux mounted, how flash is partitioned, and which processes actually own the network. On embedded devices, the configuration files alone often tell only part of that story.
The web UI also supplied useful evidence. Its JavaScript sends JSON requests with command IDs to `cgi-bin/http.cgi`. Mapping those calls exposed how settings reached the vendor backend; the [command map](https://github.com/mralinp/zlt-x28-openwrt/blob/main/docs/vendor-command-map.md) records that interface.
# 3. Repairing LuCI on the stock system
**LuCI is OpenWrt’s web interface.** Having it load does not mean the router underneath is managed by standard OpenWrt services.
The initial LuCI installation had a partly working theme, missing menus, pages that returned 404, and an Interfaces page that could not identify the protocols. We restored missing theme assets, views, menus and protocol definitions, while preserving existing files that were more complete than the replacement archive.
Some failures required tracing the request through several layers. The status overview needed an `rpcd` access-control rule to read its view directory. A small read-only RPC helper exposed protocol handlers so LuCI could name the interfaces. The vendor’s `mini_httpd` also treated `/cgi-bin/luci/` differently from `/cgi-bin/luci`; redirects needed to use the working form.
At this stage the two interfaces coexisted:
| Service | Stock-phase endpoint |
| --- | --- |
| Vendor web interface | Ports 80/443 |
| Separate LuCI instance | Port 4153, `/cgi-bin/luci` |
| Key-only SSH | Port 2222 |
A reboot supplied another lesson: files persisted, but manually started services disappeared. Startup entries brought Dropbear and the separate LuCI server back automatically.
The deeper limitation was ownership. **netifd**, OpenWrt’s network manager, was not running; the vendor stack controlled the live interfaces. The UCI network configuration described a different LAN from the one actually in use. Applying it could disconnect the router. The early Network pages were therefore inspection tools, not proof that LuCI could safely configure the whole system.
That is why the project grew beyond installing a web panel. We needed to move network ownership to OpenWrt. The [LuCI fix notes](https://github.com/mralinp/zlt-x28-openwrt/blob/main/docs/luci-fix-notes.md) preserve the early fixes and their limits.
# 4. Proving recovery before replacing the system
Before changing the root filesystem, I needed to know what was on the flash and how to put it back.
The project started with **hash-verified backups of all 51 NAND partitions**. A router backup includes much more than the operating system: boot components, modem firmware, calibration and device-specific data. Losing those can turn a recoverable software mistake into a much harder problem.
Then came the independent USB path through the MediaTek preloader and download agent. All 51 partitions were read over USB. The guarded tools also wrote and restored `rootfs_a` and `rootfs_sig_a`, establishing a recovery path for the targets the native image needed.
A read succeeding does not establish that every partition can be restored. For example, download-agent writes to `misc` were not acknowledged; the project uses the stock live NAND method for that metadata. That limit is documented rather than hidden behind a general claim that recovery works.
The write tools check their targets, preserve receipts, and compare the other slot and neighboring partitions before and after writes. A 1.8 V UART provides visibility when Linux and SSH are unavailable.
This was a substantial part of the project in its own right. The [recovery documentation](https://github.com/mralinp/zlt-x28-openwrt/blob/main/docs/RECOVERY.md) records the equipment, checks and limits. This post is not an installation recipe; flashing needs the full device-specific procedure.
## Finding and wiring the UART
SSH only becomes available after Linux and the network start. A UART serial console lets us see the earlier preloader and bootloader messages, including failures that never reach SSH.
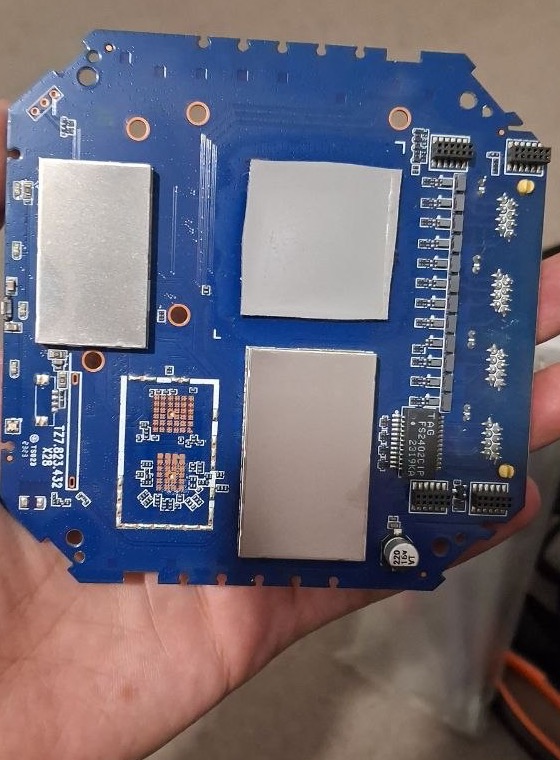
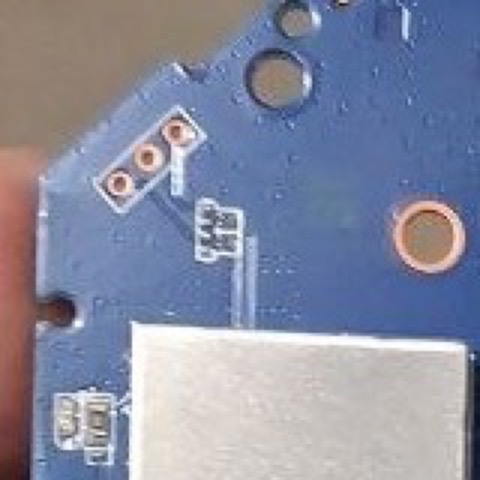
The back of the actual board. The three-hole footprint near the top-left corner is the serial-console connection. Click to enlarge.The UART footprint close up. Its repository filename still says “candidate”; the wiring was subsequently confirmed on the test unit.
Following the orientation in these photos, the holes run **board RX, GND, board TX**, from the left/lower end of the diagonal footprint to its right/upper end:
| Board signal | Connection |
| --- | --- |
| RX | Adapter TX through a suitable level shifter; omit for passive capture |
| GND | Adapter and level-shifter ground |
| TX | Adapter RX through a suitable level shifter |
**The board uses 1.8 V logic. There is no VCC pin on this footprint.** Do not connect the adapter’s 3.3 V or 5 V power pins, or drive board RX directly from a 3.3 V transmitter. Use a suitable level shifter or a genuinely 1.8 V-capable adapter.
The tested unit decoded at **921600 baud, 8N1**. Another unit was reported at 115200, so the rate needs checking against the unit’s kernel command line or boot log. Early captures also exposed bad-ground and voltage-level problems. On macOS, opening a port separately with `stty` and then `cat` could reset the rate; configuring the same open descriptor avoided that trap.
For the first passive capture, adapter TX was disconnected. We could then observe the preloader, LK and Linux without sending anything to the board. A serial output stream is also distinct from an interactive login: the stock firmware’s getty was commented out, so seeing logs did not initially give us a UART shell.
The [recovery guide](https://github.com/mralinp/zlt-x28-openwrt/blob/main/docs/RECOVERY.md) is the source for the corrected pinout and electrical requirements; the [UART report](https://github.com/mralinp/zlt-x28-openwrt/blob/main/docs/research/uart-boot-log.md) preserves the earlier boot observations.
# 5. Understanding the boot path
The X28 has A/B firmware slots, but knowing that two slots exist does not explain when the device will switch between them.
The investigation combined partition dumps, live observations, UART logs and static analysis of the boot components. It covered slot metadata, boot counters, rootfs signature handling and the information passed from the bootloader to Linux. Each finding needed a clear boundary between what the bytes suggested and what a real boot confirmed.
The native root filesystem now runs on **slot A**, while **stock slot B remains untouched**. The image keeps the vendor boot components and kernel; booting this rootfs does not establish that an arbitrary replacement kernel will boot.
One particularly important detail was the boot-success logic. The preloader adds a try on each boot. The project's `x28-bootok` resets the counter after a good boot, following the relevant stock behavior. Slot A deliberately retains a zero success flag to preserve the preloader's fallback behavior. The stock success path also copies A over B, which would consume the stock fallback this project is preserving.
A seemingly harmless “mark boot successful” operation therefore required understanding its wider effects. The [boot-flow research](https://github.com/mralinp/zlt-x28-openwrt/blob/main/docs/BOOT-FLOW.md) keeps the evidence and its dated updates.
## Reverse engineering the boot binaries
The UART showed which checks ran. Understanding what those checks meant required examining the saved binaries themselves.
**LK**, or Little Kernel, is the bootloader stage that loads the kernel and prepares its boot information. We analyzed its original NAND dump using Capstone disassembly and later Ghidra. These tools turn machine instructions into assembly and approximate C-like pseudocode; neither recovers the vendor’s original source code.
Getting the processor mode and address mapping right mattered. This LK image has an ARM entry stub that switches into Thumb code. The Ghidra analysis mapped the raw image at `0x83fffe00`, accounting for its partition header. A plausible-looking decompilation with the wrong mapping would have been poor evidence, so the scripts first checked the input size, hash and mapped bytes.
The investigation followed a concrete sequence:
1. Find partition names, diagnostic strings and references to them in code.
2. Trace calls, return values and branches around certificate verification.
3. Follow a returned error into the assertion and panic path.
4. Extract certificate data and independently check what its signatures covered.
5. Compare those findings with the boot log, live device-tree properties and later native boots.
One result was precise: **a returned rootfs-certificate verification error leads to a panic/halt path**. It does not simply print a warning and immediately boot the other slot. That conclusion came from traced instructions, not from deliberately booting an invalid certificate.
Another result required separating two questions. The `rootfs_sig` partition contains a certificate chain whose signed data includes the stock SquashFS digest and size. We reconstructed the logical SquashFS from its UBI container and matched the digest. Independent RSA-PSS checks corroborated the signed message ranges. But verifying a certificate containing a digest is different from reading the current rootfs and comparing its bytes with that digest.
The static investigation found no visible normal-boot consumer performing that content comparison. That was initially a hypothesis with explicit gaps, including unexamined secure-world behavior. The later native boot provided the practical result: our changed rootfs ran with the original rootfs certificates and unchanged captured boot components. It established that particular combination works on this unit.
**It did not establish that an unsigned replacement kernel would boot.** LK’s boot-image path has separate policy, certificate, header and payload authentication checks. We mapped those paths in Ghidra as a separate investigation. A later two-branch patch preview stayed inside a local Ghidra database; it was not exported, flashed or executed on the device.
The preloader investigation also had an honest stopping point: relocation and table-driven references prevented us from fully recovering the invalid-slot-to-USB-handshake path in the initial analysis. A backup and a working USB session were not enough to claim every possible boot failure recoverable.
For the full evidence, see the [signed-content analysis](https://github.com/mralinp/zlt-x28-openwrt/blob/main/docs/research/rootfs-signed-content.md), [content-enforcement investigation](https://github.com/mralinp/zlt-x28-openwrt/blob/main/docs/research/content-enforcement.md), [LK authentication map](https://github.com/mralinp/zlt-x28-openwrt/blob/main/docs/research/lk-authentication-ghidra.md), and [local patch preview](https://github.com/mralinp/zlt-x28-openwrt/blob/main/docs/research/lk-boot-auth-preview.md).
# 6. A modern userspace on the vendor kernel
Replacing the kernel would also mean replacing or rebuilding the drivers that make this particular board and modem work. The practical first step was to keep Linux 4.19.205 and assemble a newer OpenWrt userspace around it.
The resulting system has three parts:
| Layer | What it provides |
| --- | --- |
| OpenWrt 23.05.5 userspace | LuCI, UCI, netifd, DHCP/DNS and standard packages |
| Vendor hardware support | The existing kernel, board modules, modem and Wi-Fi components |
| Project packages | Cellular integration, modem startup, Wi-Fi handling, LEDs, boot-counter handling and additional kernel modules |
Kernel capabilities constrain the userspace. The stock kernel lacks `nf_tables`, so this build uses **fw3 and iptables-legacy**. Official OpenWrt kernel modules cannot simply be installed onto a different vendor kernel, even when userspace packages work.
The build also respects the distribution boundary. Public CI assembles the open userspace and publishes its manifest and hashes. Local tooling combines that with proprietary components extracted from the owner's own backup. The public repository distributes build tools and original packages; it does not publish the vendor firmware as a ready-to-flash image.
The [build documentation](https://github.com/mralinp/zlt-x28-openwrt/blob/main/docs/BUILD.md) explains how those halves meet.
# 7. Making 5G a normal OpenWrt interface
The modem already had a working vendor stack. The integration problem was giving OpenWrt control over the connection without letting the vendor's network policy managers compete with it.
The project's `x28_mipc` netifd protocol uses the vendor modem CLI as its backend. It reports the bearer device, addresses, routes and DNS to netifd, and has an ordinary LuCI protocol page. It supports IPv4, IPv6 and dual-stack operation, including APN selection from the SIM when none is explicitly configured.
Lifecycle ownership matters here. The handler refuses setup while the conflicting vendor WAN manager is running, validates modem replies, serializes operations and records the connection identifier it owns. Cleanup targets that identifier.
Real hardware caught something the mocks did not: after activation, the kernel left the `ccmni` bearer interface down. Checking link readiness immediately produced a loop of activation, failure and teardown. Bringing the validated interface up before checking it fixed the sequence.
Another first-boot failure came from an omitted APN database. The image needed the data file as well as the executable that used it. Those details are why a successful package build is only one stage of firmware validation.
The modem now starts at boot, and the connection integrates with LAN routing, NAT and firewall policy. The [cellular notes](https://github.com/mralinp/zlt-x28-openwrt/blob/main/docs/NATIVE-CELLULAR.md) record the implementation and remaining reconnect and operator-testing limits.
# 8. WireGuard and Passwall2 on an unfamiliar kernel
VPN support was a main reason for doing the port. The stock kernel did not provide everything those packages needed.
WireGuard uses a locally built compatibility module. Passwall2's transparent proxy path needed additional TPROXY and socket modules, plus a small shim for two UDP lookup symbols the stock kernel did not export.
Matching the kernel version string was insufficient. Comparing module symbol versions exposed differences between the available sibling-device kernel source and the X28's shipped kernel. The modules ultimately used on the unit were built without symbol-version CRC checks. Comparisons of the relevant code and offsets, followed by live traffic tests, provided evidence for that specific build.
**This remains a compatibility risk.** Removing a version check does not prove ABI compatibility, and a clean test cannot rule out a later kernel crash. The modules load after a good boot with a crash guard; exact vendor source and longer hardware validation remain valuable work.
With those modules, Passwall2 carried LAN clients' TCP, UDP and IPv6 traffic through the configured node, could be switched from LuCI, and returned after reboot. The [kernel-module investigation](https://github.com/mralinp/zlt-x28-openwrt/blob/main/docs/research/kernel-module-crc.md) records both the initial rejection and the later result.
## Passwall2 in the real LuCI interface
Passwall2 is a LuCI application for configuring proxy routing. Xray handles the selected proxy protocol; firewall rules steer traffic into it. With transparent proxying, LAN devices can use that path without each device running its own proxy client.
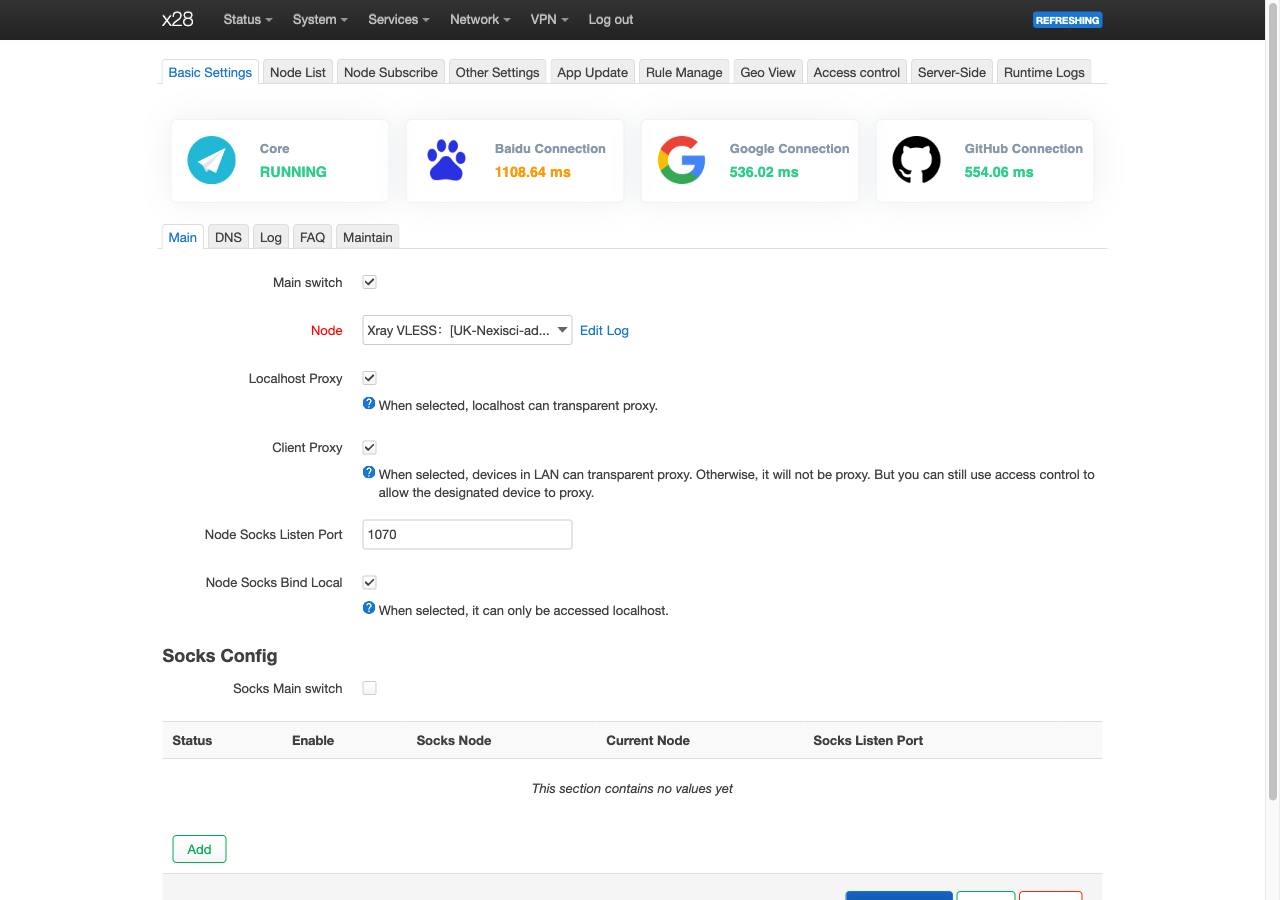
Passwall2 on the test X28: the core is running, with router-originated and LAN-client proxying enabled. This is the repository’s actual LuCI screenshot, not the illustrated cover. Click to enlarge.
The two checked controls cover different traffic: **Localhost Proxy** covers traffic originating on the router, while **Client Proxy** covers eligible LAN-client traffic under the configured rules. A green running indicator alone cannot prove forwarding works, so validation also exercised real TCP, UDP and IPv6 traffic, toggling the service and reboot persistence.
The work crossed several layers: supply Xray and its userspace dependencies, build the missing kernel support, make `ipset` packaging agree with what this kernel actually provides, and keep Passwall2 on its iptables path. The image build now requires the needed modules and packages rather than leaving those dependencies as manual installation surprises.
The screenshot shows the configuration state; the [Passwall2 report](https://github.com/mralinp/zlt-x28-openwrt/blob/main/docs/PASSWALL2.md) and testing record carry the traffic evidence.
# 9. What the hardware actually carried
These measurements were made on November 2. For WireGuard and OpenVPN, `iperf3` ran between the router and a LAN peer, removing the cellular carrier and a remote internet server from the path.
| Test | Router sends | Router receives | Observation |
| --- | --- | --- | --- |
| No tunnel, reference | 856 Mbit/s | 363 Mbit/s | Limited by the test laptop's path |
| WireGuard, four streams | 715 Mbit/s | 330 Mbit/s | About 55–58% aggregate CPU use across four cores |
| OpenVPN, AES-128-GCM, mbed TLS | 102 Mbit/s | 58 Mbit/s | About one core's worth of CPU |
| OpenVPN, AES-256-GCM, OpenSSL | 74 Mbit/s | 84 Mbit/s | About one core's worth of CPU; this is the shipped build |
WireGuard still had CPU headroom at 715 Mbit/s. That is an observed result for this setup, not a claim about the router's maximum throughput or its 5G speed.
Passwall2 was tested separately with a LAN client: about **206 Mbit/s down and 40 Mbit/s up**, with the link limiting the run. The project discusses an estimate of further capacity; I am keeping the table here to measured results. These proxy measurements are not directly comparable to the router-endpoint VPN tests.
The SoC idled at about 40 °C on the native firmware and stayed below 48 °C during these tests. The recorded stock idle baseline was about 65 °C without a fan. These observations are encouraging, but do not establish how every X28 behaves thermally.
Commands, CPU observations and test limits are in the [testing record](https://github.com/mralinp/zlt-x28-openwrt/blob/main/docs/TESTING.md) and [Passwall2 notes](https://github.com/mralinp/zlt-x28-openwrt/blob/main/docs/PASSWALL2.md).
# 10. What is still unfinished
The native image boots and carries traffic on physical hardware. LuCI, wired LAN, cellular networking, LEDs, Wi-Fi client connectivity and the tested VPN/proxy paths work on the test unit.
A stable release still needs more evidence:
- Longer soak testing, including investigation of falling available memory seen during a 26.6-hour run.
- Wi-Fi throughput testing and broader SIM, carrier and hardware-revision coverage.
- Longer reconnect and WireGuard tests, plus LAN-forwarded VPN benchmarks.
- Server-side validation of the installed L2TP and PPTP clients.
- A dedicated recovery slot and a supported `sysupgrade` path for the intended layout.
The future recovery-slot design would replace the second full firmware with a smaller rescue system. Today, stock B remains the fallback. SMS and voice work from the earlier stock-overlay phase also still need integration into the native image.
# 11. What the walkthrough taught me
The work I value most is the chain of evidence behind the running system: a complete backup, independently read flash, narrowly tested restore operations, an understood boot path, a modem managed through netifd, and performance measurements with their limits attached.
Every layer forced the next question. A booting image needed working networking. A working tunnel needed a meaningful benchmark. A successful write needed a readback. A newer userspace needed to respect the older kernel underneath it.
That is what made this a serious engineering project for me. The visible result is an OpenWrt router. Behind it is a growing, reproducible explanation of how this hardware works and how to keep improving it without losing the way back.
The [repository](https://github.com/mralinp/zlt-x28-openwrt) includes the tools, packages, research and test record. If you have the same hardware, comparing board revisions, firmware versions and recovery observations would be particularly useful.
For someone new to the project, the progression is worth keeping in view: **shell access → understand the stock system → observe the boot → verify backups and recovery → build the replacement → validate real traffic**. Each stage supplied the evidence needed for the next. That is also a useful way to read the repository: start with the README, follow the recovery and boot research, then the build, cellular and testing records.
---
# ez-crawl: A Year on a Crawler That Finally Works
- URL: https://alinaderiparizi.com/blog/ez-crawl/
- Date: 2026-10-12
- Kind: Blog post
- Topics: ez-crawl, ai, startup
- Summary: ez-crawl turns websites into structured data with pipelines you draw on a canvas. A year of work, and where it stands now: early, live, and not finished.
**ez-crawl** reads websites and gives you back tidy records. You draw the route on a canvas, press run, and get a table you can search, sort and download.
I have been working on it for a year. It works now. It is not a finished product. It is an early-stage startup, and this is the honest picture of where it stands.
## The problem
Every team that needs data from the web ends up in the same place. Someone writes a scraper. The site changes a class name. The scraper breaks. Someone patches it. Repeat.
Selectors are a bet on how a page is built today. Language models read pages the way a person does: by what they say. That is the whole idea behind ez-crawl. Describe the record you want, and let a model pull it out of the page.
## Where it started
The first version was a Streamlit script. A URL in, a JSON blob out, saved to a table. It proved the idea and nothing else. It had no accounts, no retries, no way to follow links in a controlled way, and no way to see what went wrong.
The script taught me what the product is not. It is not a prompt box. A single prompt cannot crawl a directory of ten thousand companies, follow each link, and extract one clean record per page. That takes a pipeline.
## How it works
Every job is a graph of nodes joined by lines. Here is one on the canvas, mid-run: three lanes crawl a shop catalog, a quotes API and an exchange feed, then merge into one daily brief. Each node shows its state and keeps its output.
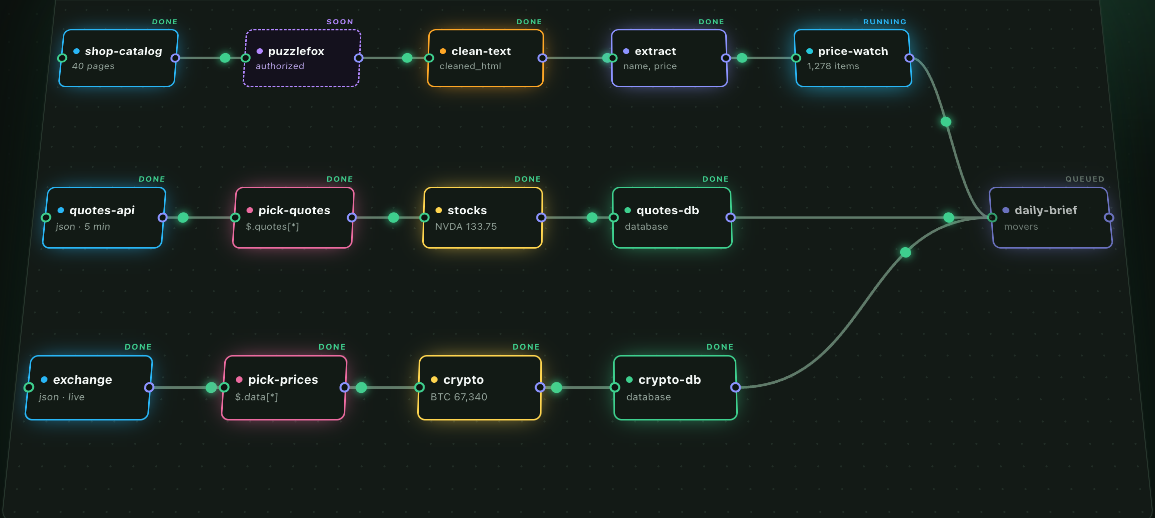
The simplest useful shape has four steps:
1. **Fetch.** Say where to start, how deep to follow links, and which links count.
2. **Convert.** Each page becomes clean text.
3. **Extract.** List the fields you want. A model returns one record per page.
4. **Keep and show.** Records go to your own database and into a table you can read at once.
Settings are in plain language: pages to read, how many levels of links to follow, which link patterns to keep, a pause between requests, and a field list instead of a schema. Results land in a table you can search, sort and download as CSV or JSON.
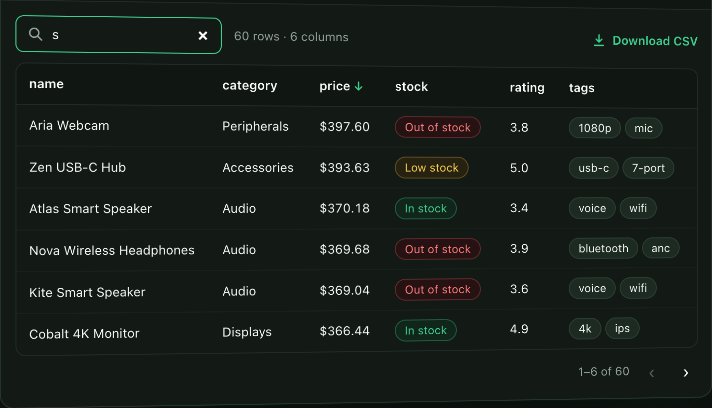
That is the starting point, not the limit. The engine runs any valid graph: branches, joins, several entry nodes, the same node type used many times. A query node can read what an earlier run stored and feed those URLs into a new fetcher. Nodes transform HTML, select from JSON, store artifacts, answer questions from evidence, and draw charts. Complex flows are the point. A site worth crawling is rarely one list and one detail page.
The sites that matter are also the hard ones: pages built by JavaScript, content behind scrolling and clicks, protection that treats an automated reader as a threat. Getting reliable data from those is where the engine is headed. Each one is a flow to design, test on a handful of pages, and then scale.
## The architecture
Three services, each with one job.
- **The app.** A React and TypeScript canvas. It holds no secrets and talks to one backend.
- **The API.** The only public backend. Accounts, workspaces, versioned workflows, teams, run history, and your own model and storage connections, with encrypted secrets.
- **The engine.** Internal only. It validates the graph, runs the nodes in order, drives the browser, calls the model, and writes to storage.
The engine knows nothing about users. The API sends it everything a run needs, and it keeps no settings of its own. That split keeps the pieces clean.
The engine works with local models through Ollama, and with OpenAI-compatible endpoints, OpenAI, Anthropic and Gemini. Results can go to your own database and storage.
## Agents can build pipelines
This is the part I like most.
ez-crawl exposes an MCP endpoint. Connect Claude Code or Codex, ask for a pipeline in plain words, and the agent builds it node by node, validates it, runs it, and checks its own output. You watch it appear on the canvas in real time.
I used that to test the product. The agent studies a site, builds a small run, reads the first records, finds the mistake, and fixes it before the big run starts. It also hit the same traps a person hits, and those traps are now written into the guide it reads. Prune filters that turn a list page into thirty characters. Links followed without limits. Fields that run together.
A product that an agent can drive is a product with a clear contract. That discipline paid for itself.
## Where it stands
Live and working on the real backend:
- Sign-in with admin approval, workspaces, saved workflows, run history, teams.
- Your own model endpoints and databases as resources.
- Per-node settings in plain language, per-node output, and a data viewer with CSV and JSON export. Right-to-left text works.
Not done yet:
- The database and file browsers still show mock data until the backend routes ship.
- Usage and storage allowances are placeholders.
- Errors need to be readable by a person, not only by me.
- Cancelling a running job, and warnings on a node that got almost no input.
I am listing the gaps because a launch post that hides them is worthless. The core loop is real. The edges are not polished.
## What the year taught me
**Start with the contract.** The service boundaries and the API shape were decided on paper before they were coded. Every change since has been cheaper for it.
**Test small, then big.** A model run over thousands of pages shows you nothing until it ends. Eight pages first. Read the records. Then scale.
**The cheap model is a trap on messy pages.** Compare two models on a sample before you commit to a crawl.
**Be polite to the sites you read.** Delays between requests, limits on pages, respect for terms. A crawler that behaves badly gets blocked, and deserves to be.
## What comes next
Real database and file browsers. Usage and plans. Better errors. Cancel and warnings. Then more people on the product, and their sites breaking it in ways I have not seen yet.
The idea is sound and it runs. Now it has to be made excellent. That is the work.
---
# OpenWrt and Passwall: Google WiFi vs Linksys MX5300
- URL: https://alinaderiparizi.com/blog/network/openwrt/2026/10/11/openwrt-passwall-google-wifi-vs-mx5300.html
- Date: 2026-10-11
- Kind: Blog post
- Topics: network, openwrt
- Summary: What OpenWrt is, what Passwall adds on top of it, and how two routers, a Google WiFi (Gale) and a Linksys MX5300, behave under the same config and the same speed test.
The router that your ISP or a vendor gives you is a closed box. You cannot see inside it, you cannot fix it, and you cannot make it do what you need. OpenWrt removes that limit. This post covers what OpenWrt is, what Passwall is, how they differ, and what happened when I ran the same setup on two very different routers.
# 1. What is OpenWrt
OpenWrt is a free Linux distribution for routers. It replaces the vendor firmware with a small, real Linux system: a package manager (`opkg`/`apk`), a firewall (nftables), a config system (UCI), and a web interface (LuCI).
What you get:
- **Control.** Every service, every firewall rule, every radio setting is yours.
- **Packages.** WireGuard, adblocking, SQM, VLANs, monitoring. Install what you need, nothing else.
- **Updates.** Vendors drop support after a few years. OpenWrt does not.
- **Freedom.** The source is open. You can read it, change it, and trust it more than a blob.
# 2. What is Passwall
OpenWrt is the operating system. **Passwall is a package that runs on it.**
Passwall (`luci-app-passwall`) is a LuCI app for proxy routing. It wraps proxy cores such as Xray, V2Ray, sing-box and Hysteria, and lets the router decide, per destination, what goes through a proxy node and what goes direct. You configure nodes, rule lists (geosite/geoip), DNS handling and a transparent proxy mode. Every device on the network gets it without installing anything.
# 3. The difference
| | OpenWrt | Passwall |
|---|---|---|
| What it is | Router operating system | An app installed on OpenWrt |
| Scope | Everything: network, Wi-Fi, firewall, DNS, DHCP | Only proxy routing |
| Works without the other | Yes | No, it needs OpenWrt |
| Cost to the router | Light | Heavy: crypto, packet marking, DNS splitting |
The last row matters. OpenWrt on its own barely loads the CPU. Passwall pushes traffic through a userspace proxy core, so the router CPU does real work on every packet. That is why hardware matters, and why I tested two routers.
# 4. The hardware
| | Google WiFi (Gale, AC-1304) | Linksys MX5300 (Velop) |
|---|---|---|
| SoC | Qualcomm IPQ4019, 4x Cortex-A7 | Qualcomm IPQ8072A, 4x Cortex-A53 |
| RAM | 512 MB | 1 GB |
| Wi-Fi | Wi-Fi 5, 2x2 dual band | Wi-Fi 6, tri-band |
| Ports | 2x GbE | 4x GbE + 2.5G-class uplink options (verify on your unit) |
| OpenWrt version | 25.12.5 (r33051) | 25.12.5 |
# 5. The test
I did not want a VPS, Cloudflare or my ISP in the measurement, so I built the test around the router alone:
- A local **Xray server** on a laptop on the router's WAN side, with an iperf3 server behind it.
- A second cable from the same laptop into the router's LAN, as the client. Traffic goes laptop, router (transparent Passwall2), Xray server, iperf3.
- `iperf3 -P 8` for 20 seconds, both directions, three repetitions, median. Router CPU is read per core from `/proc/stat` during each run.
- Same OpenWrt release (25.12.5), same Passwall2, same server, same settings on both routers. Only the router changes.
The scripts are in the [wrtforge](https://github.com/mralinp/wrtforge) repo under `bench/`.
One limit I must state: my laptop's wired adapter is 100 Mbps. Any result near 94 Mbps means "the adapter ended the test", not "the router has more to give".
# 6. Results
**Google WiFi (Gale), IPQ4019, 4x Cortex-A7, 512 MB**
| Tunnel | Down | Up | Busiest core (down / up) |
|---|---|---|---|
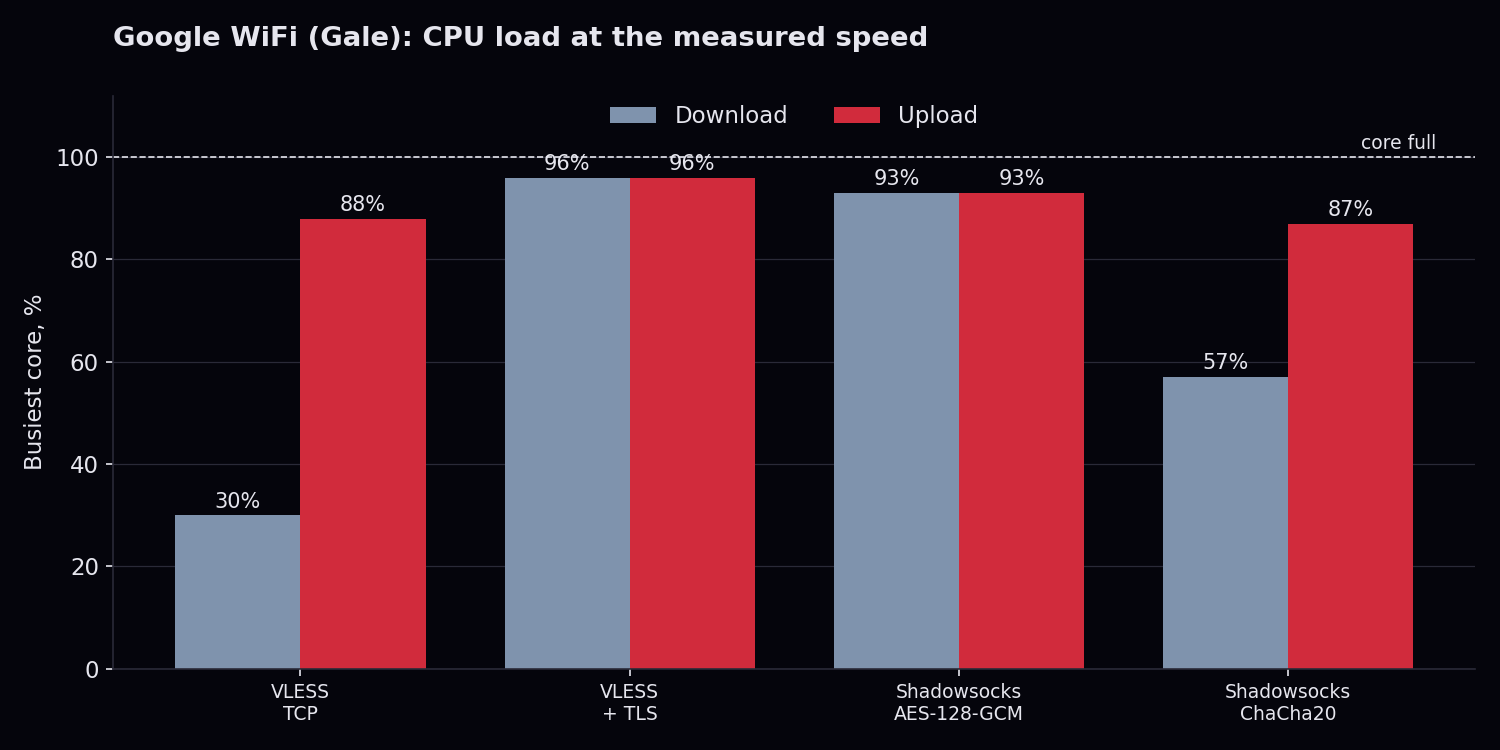
| VLESS over TCP, no encryption | 94 Mbps | 94 Mbps | 30% / 88% |
| VLESS with TLS | 41 Mbps | 42 Mbps | 96% / 96% |
| Shadowsocks, AES-128-GCM | 45 Mbps | 44 Mbps | 93% / 93% |
| Shadowsocks, ChaCha20-Poly1305 | 94 Mbps | 94 Mbps | 57% / 87% |
The busiest core during each test. TLS and AES leave nothing; the other two still had room on download.
**Estimate for a gigabit port (not measured)**
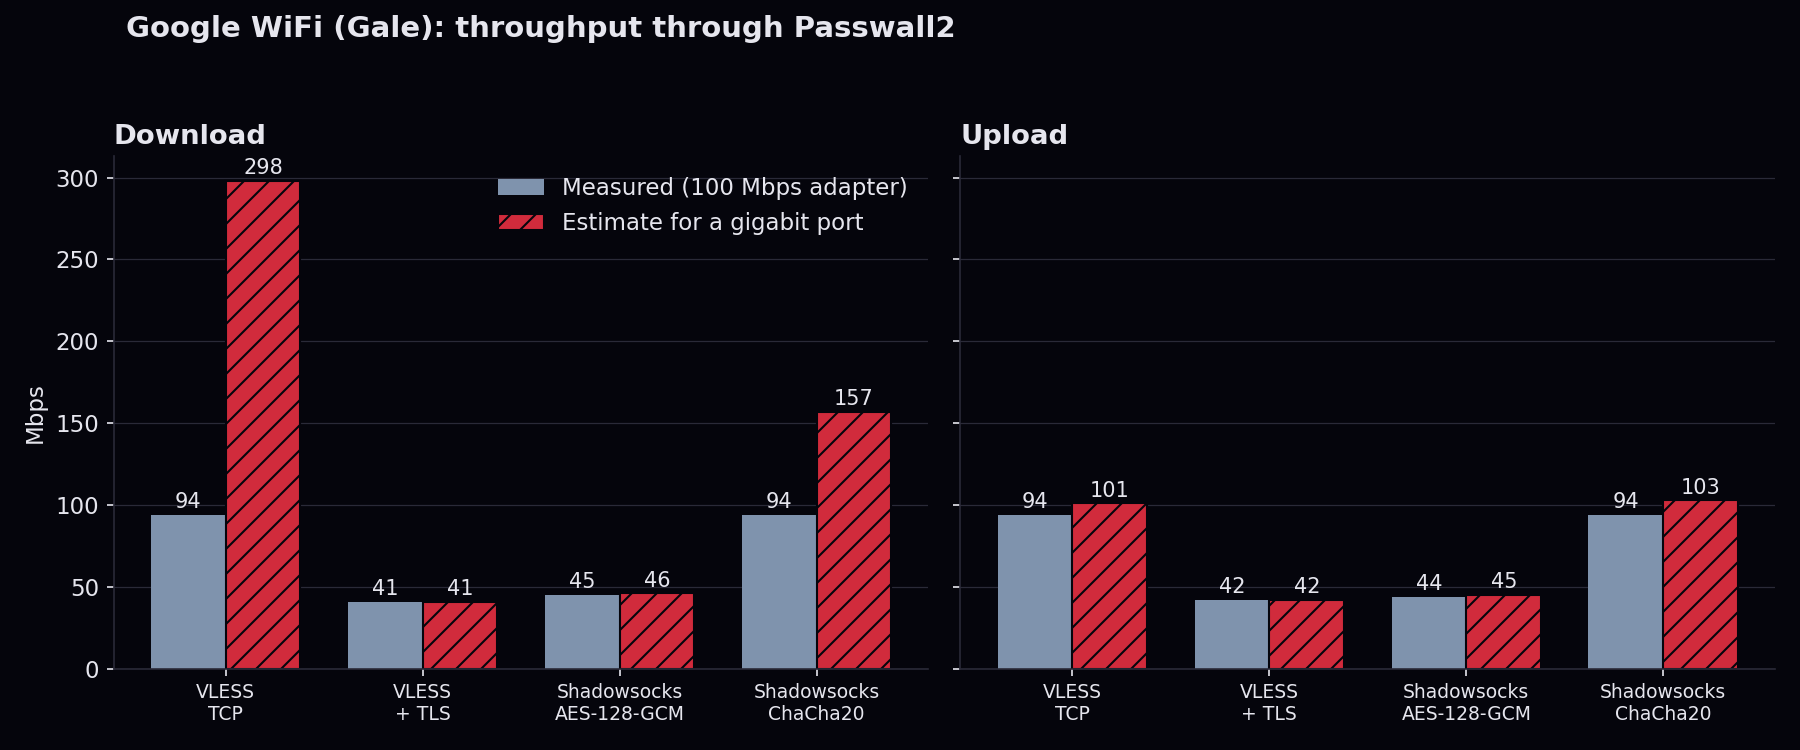
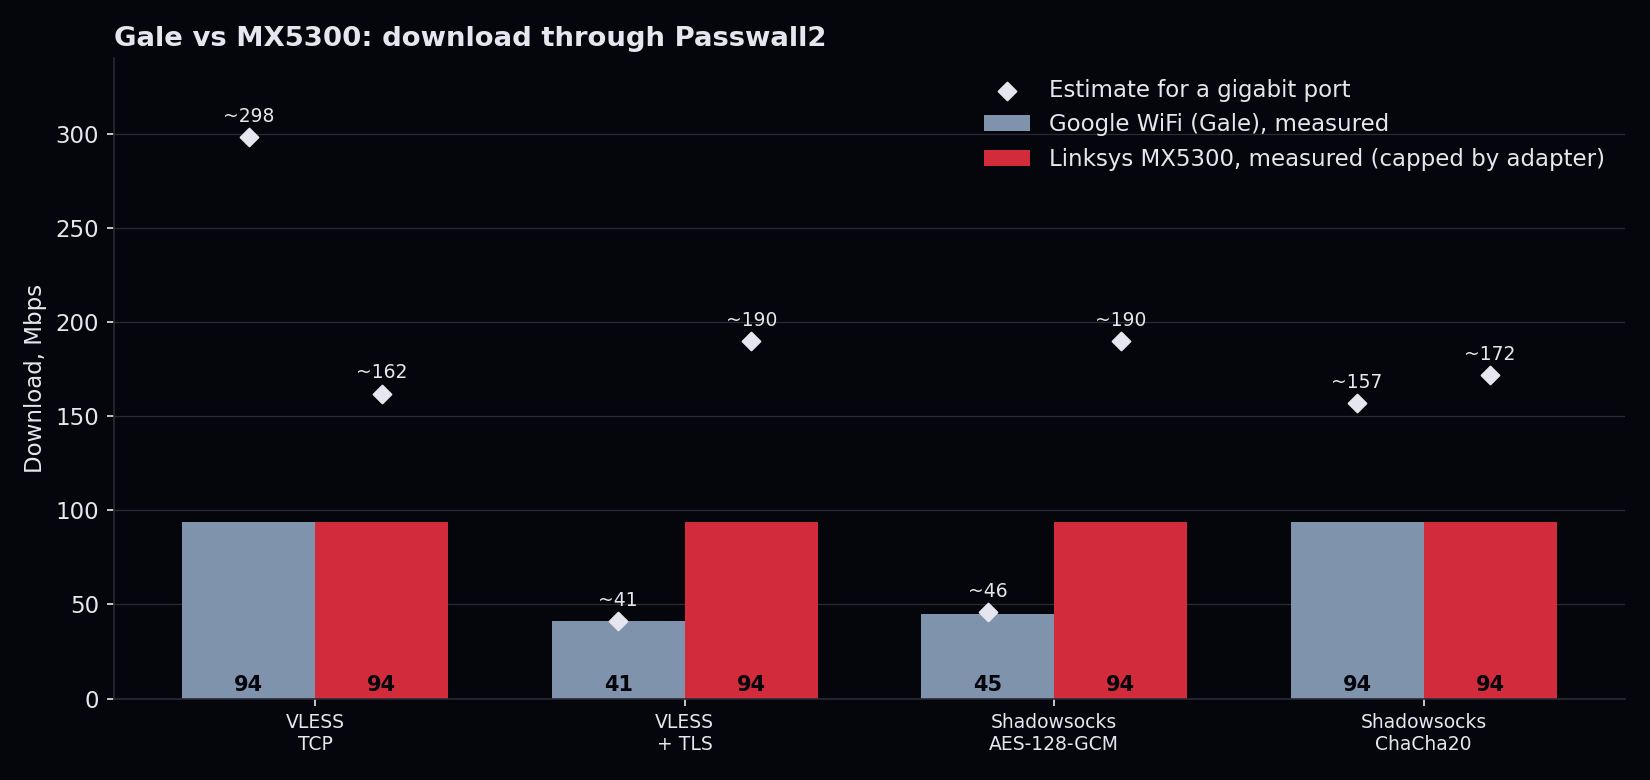
Two rows above stopped at my 100 Mbps adapter while the Gale still had CPU left. To guess where they would end with a gigabit cable, I scaled each measured speed by the CPU left on the busiest core:
`estimate = measured speed x 95 / busiest-core CPU %`
I used 95, not 100, because the last few percent of a core is never usable. This is a straight-line guess, not a measurement, and real routers lose a little more to interrupts and memory as load rises. Treat it as the order of magnitude. I applied the same formula to all four tests, so the two that were already CPU-bound barely move.
| Tunnel | Down measured | Down estimate | Up measured | Up estimate |
|---|---|---|---|---|
| VLESS over TCP, no encryption | 94 Mbps | about 300 Mbps | 94 Mbps | about 100 Mbps |
| VLESS with TLS | 41 Mbps | about 41 Mbps | 42 Mbps | about 42 Mbps |
| Shadowsocks, AES-128-GCM | 45 Mbps | about 46 Mbps | 44 Mbps | about 45 Mbps |
| Shadowsocks, ChaCha20-Poly1305 | 94 Mbps | about 160 Mbps | 94 Mbps | about 100 Mbps |
Solid bars are measured. Hatched bars are the estimate. Only the two tunnels that were not CPU-bound move.
Upload is the weak direction: it already used 87 to 88% of a core at 94 Mbps on the two uncapped rows, so it has almost no headroom, and I would not promise more than about 100 Mbps there.
**Linksys MX5300**, IPQ8072A, 4x Cortex-A53, 1 GB
Same test, same adapter limit, so every row ended at the cable. The useful number is how much CPU it took.
| Tunnel | Down | Up | Busiest core (down / up) | Down estimate for gigabit |
|---|---|---|---|---|
| VLESS over TCP, no encryption | 94 Mbps | 94 Mbps | 55% / 11% | about 160 Mbps |
| VLESS with TLS | 94 Mbps | 94 Mbps | 47% / 14% | about 190 Mbps |
| Shadowsocks, AES-128-GCM | 94 Mbps | 93 Mbps | 47% / 14% | about 190 Mbps |
| Shadowsocks, ChaCha20-Poly1305 | 94 Mbps | 93 Mbps | 52% / 17% | about 170 Mbps |
Two cautions on the estimate. First, the MX5300 test client was on Wi-Fi, so part of that CPU is the radio, not the tunnel; the true tunnel limit is probably higher than these numbers. Second, I did not estimate upload: at 11 to 17% of a core the straight-line scaling would claim 500 Mbps or more, which I cannot back up. For the MX5300 the honest statement is "at least 94 Mbps, with more than half the CPU free on download".
Bars are measured, diamonds are estimates. The MX5300 bars are a floor: the adapter ended the test, not the router.
# 7. What this says
On the Gale, **encryption is the limit, not the radio and not the ports.** With TLS or AES the CPU is at 93 to 96% and the speed stops at about 41 to 45 Mbps. Switch the cipher to ChaCha20 and the same router reaches the 94 Mbps my adapter allows, with CPU to spare on download. The Cortex-A7 has no AES instructions, so AES in software is slow, and ChaCha20 is built to be fast on exactly that kind of CPU.
The practical rule: on a Gale, if you want more than 40 Mbps through a proxy, choose ChaCha20 over AES, or drop TLS where the link does not need it.
The MX5300 shows the opposite picture. TLS and AES cost it almost nothing extra, its CPU sits around half-loaded at 94 Mbps, and the cipher you pick does not change the result. On the same test where the Gale falls to 41 Mbps, the MX5300 is at least 2.3 times faster and was still not working hard. Its Cortex-A53 cores report the ARM AES and SHA instructions (`aes pmull sha1 sha2` in `/proc/cpuinfo`); the Gale's Cortex-A7 is an older ARMv7 design without them.
Not tested: a plain routing baseline with Passwall off (it needs a second machine), WireGuard and OpenVPN.
# 8. Setup notes
**Firmware.** Both routers run the official OpenWrt 25.12.5 images from downloads.openwrt.org, not a vendor build or a third-party fork. Same OpenWrt release on both, and the same Passwall2 and Xray setup driving the test, so the router is the only variable I changed.
**Flashing: follow the OpenWrt guides.** I flashed both routers by the official OpenWrt installation steps for each device, and you should too. Do not copy a flashing recipe from a blog post, including this one; the right method depends on your exact model and revision, and a wrong step can brick the router. Each device has its own page in the OpenWrt Table of Hardware with the supported install methods:
- [Google WiFi (Gale)](https://openwrt.org/toh/google/wifi): restore with Google's recovery mode if needed, then boot OpenWrt from a USB stick in Developer Mode and write it to the internal storage.
- [Linksys MX5300](https://openwrt.org/toh/linksys/mx5300): installing from the stock firmware (through the firmware update page or the web interface), or via TFTP or USB from U-Boot.
Read the whole page first, back up before you flash, and keep the recovery method ready.
**After the first install: wrtforge.** Once a router runs OpenWrt, [wrtforge](https://github.com/mralinp/wrtforge) does the rest over SSH. It finds the official image for your exact board on downloads.openwrt.org and checks its sha256. It saves a verified backup first, with a recovery path, then flashes with `sysupgrade`. Then it installs Passwall2 and its dependencies from the official feeds, so nothing comes from a random mirror. One command, and `--dry-run` shows the plan without changing anything. Its first install on a device still follows the guide above; it is the upgrades and the Passwall2 setup it automates.
**Passwall2.** Runs on top of OpenWrt as a package. Its dependencies, Xray first, go in before the app; if a saved Passwall2 config starts with Xray missing, its half-loaded firewall rules cut the router's own internet. wrtforge installs them in that order.
**Benchmark tooling.** The test is two small scripts in the same repo (`bench/server.sh` and `bench/run.sh`). wrtforge also has a quicker speed check in its menu, but it measures your connection, not the router's ceiling, so I did not use it for these numbers. The router's Passwall2 config is backed up before each run and restored after it, so a test never leaves a router in a test state.
**What broke on the way**, in case you repeat this:
- **A 100 Mbps USB adapter.** It capped every fast result at 94 Mbps. A gigabit adapter is the first thing to get.
- **Private IPs skip the proxy.** Passwall2 does not proxy 192.168.x.x addresses, so a test server on the LAN would have been bypassed. The client targets a made-up public address and the server redirects it to iperf3.
- **Xray 26 dropped "allow insecure".** A self-signed certificate on the TLS test needs its SHA-256 pinned instead, or the connection fails with no useful error.
- **A cipher option has a different name than you expect.** In Passwall2 the Shadowsocks cipher is `ss_method`; with `method`, Xray silently does not start.
- **Network order.** With the laptop on Wi-Fi and a LAN cable at once, macOS sent the test traffic out over the wrong interface. Put the right one first in the service order.
- **A cable test is fragile.** An adapter that sleeps or renames itself (`en7` became something else) ended a run. Check the link before you start a 10 minute matrix.
---
# Running a Startup on One Rented Server: What I Learned as Co-founder and CTO
- URL: https://alinaderiparizi.com/blog/devops/infrastructure/self-hosting/2026/10/06/running-a-startup-on-one-server.html
- Date: 2026-10-06
- Kind: Blog post
- Topics: devops, infrastructure, self-hosting
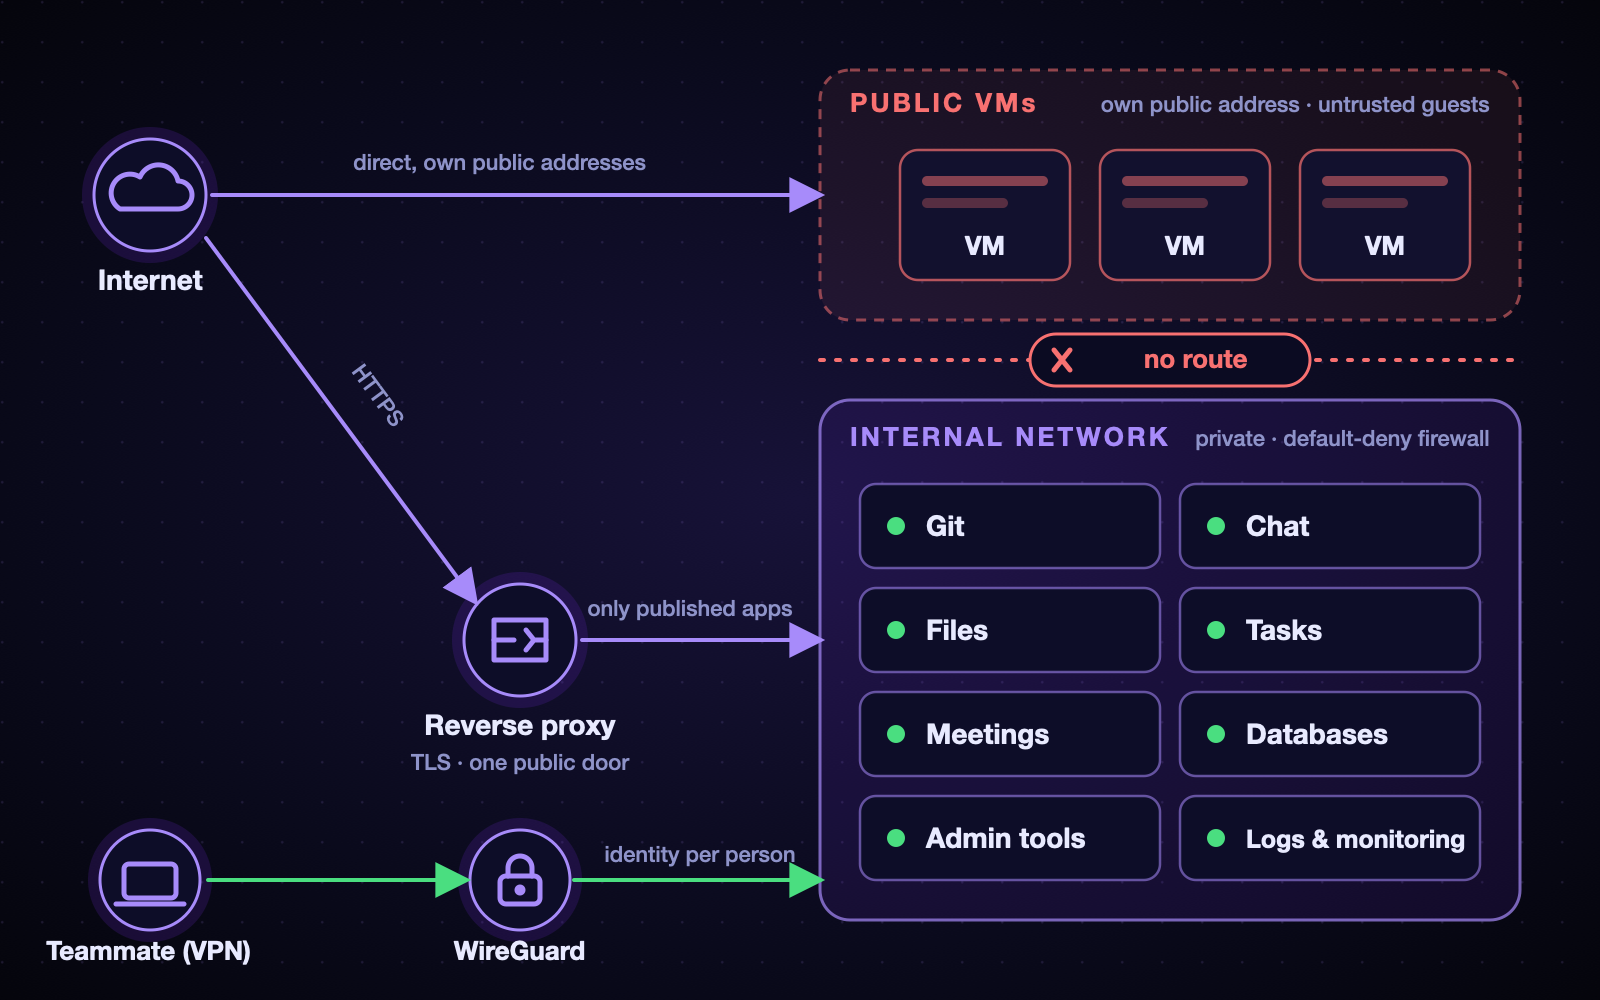
- Summary: We rented one dedicated server, and I built everything our startup runs on it: Git, chat, files, tasks, meetings, a VPN, single sign-on, monitoring and logs. This is the story: the design, the services, how they are deployed, what went wrong, and what I would do again.
When we started the company, we needed what every software team needs on day one: a place for the code, a way to talk, somewhere to put files, a task board, video meetings, a way to reach internal tools safely, and a way to see what is going on. We could have bought a stack of SaaS subscriptions. Instead we rented **one dedicated server** in a datacenter, and I built all of it myself.
I am the co-founder and CTO, and for a long time I was also the whole operations team. This post is the honest version of that experience: how the thing is designed, which services run on it and how they are deployed, the mistakes I made, and what I would tell someone about to do the same. I will stay at the architecture level on purpose; a post about security should not be a map for attackers.
# 1. Why one server
The reasons were boring and practical:
- **Cost and control.** One machine with a lot of disk and RAM is cheaper than a dozen subscriptions, and our data stays where we put it.
- **A small team.** There was no operations department. Whatever I built had to be something one person could understand, operate and fix at 3 a.m.
- **Learning.** Running the whole stack yourself teaches you things no managed service will.
The price is also real: a single server is a single point of failure, and every outage is your outage. Much of what follows is about making that tolerable.
# 2. The foundation: virtualization and snapshots
The server runs **Proxmox VE**. It lets me split one big machine into many small ones, and it gives me the feature I use more than any other: **snapshots**.
- **Containers (LXC)** for the services we run ourselves. They are light, start in seconds, and one service (or one small stack) per container keeps the blast radius small.
- **Virtual machines** for things that need their own kernel or belong to a person: databases, object storage, a CI runner, and machines our teammates use for their own work.
- **Storage tiers.** Fast SSD storage for things that need speed, a big spinning-disk pool for bulk data and backups.
My rule from day one: **take a snapshot before you touch anything.** Upgrades, migrations, config changes, all of it. More than once that single habit turned a bad evening into a two-minute rollback.
# 3. The network: two worlds and one door
The most important design decision was the network. The server has a handful of public addresses, and teammates sometimes need their own machines with their own public address. Internal services (databases, admin panels, monitoring) must never be reachable from those machines or from the internet.
So the network has two zones, and a small number of doors between them:
The two zones. Public VMs live in their own isolated zone, the internal network is reachable only through the reverse proxy (published apps) or the VPN (people), and the public VMs have no route into it.
- **Internal network.** Everything private lives here. It reaches the internet through the server, but nothing from outside can reach it directly.
- **Public bridge.** Machines that need their own public address live here, and the firewall treats them as untrusted guests: they cannot see the internal network or the host.
- **One door in: WireGuard.** To reach internal tools from home, you connect to the VPN. Each person has their own identity on it.
- **One reverse proxy** in front of everything that is meant to be public. It terminates TLS and routes by name. Nothing else is exposed.
- **A default-deny firewall**, with every opening an explicit, documented decision.
- **Anti-spoofing** for public machines: datacenters bind addresses to machines, so each public VM is only allowed to send traffic with the identity it was given. That protects the neighbors and us.
The first week of this project was not building; it was **auditing** what I had made. I found places where internal and public traffic were more mixed than I believed. Fixing that early was far cheaper than fixing it after people depended on it.
# 4. The services
Here is what runs on it, and what each replaced:
| Need | What we run | Notes |
| --- | --- | --- |
| Code hosting, CI, packages | **Gitea** + a CI runner | Lightweight, fast, our repositories stay with us |
| Team chat | **Mattermost** | Channels, threads, integrations |
| Files and calendar | **Nextcloud** | Shared files, office documents |
| Tasks and projects | **Plane** | The board the engineering team lives in |
| Video meetings | **Jitsi Meet** | Self-hosted calls with login required to host |
| Reverse proxy and TLS | **Nginx Proxy Manager** | Let's Encrypt certificates for public names |
| Identity | **authentik** | One account, one login, for everything |
| Databases and storage | **PostgreSQL**, **MongoDB**, **MinIO** | On their own machines, internal only |
| Monitoring and logs | **Grafana**, **Prometheus**, **Loki** | Dashboards, metrics, and months of logs |
| Private access | **WireGuard** (with a small web UI) | One identity per person |
# 5. How it is deployed
Nothing fancy, and that is deliberate.
- **Docker Compose inside a container** for each service or small stack. One folder, one compose file, one place to look.
- **Configuration in files, secrets outside git.** Passwords and keys live in environment files on the machine, never in a repository. Repos hold structure, not secrets.
- **Pinned versions.** I never let a service follow `latest`. Upgrades are an explicit action I take after a snapshot, not something that happens to me.
- **Declarative where it pays off.** The identity provider is configured through **blueprints** (YAML in git), so the whole login setup can be reviewed and reproduced instead of clicked together.
- **Generated dashboards and alerts.** The monitoring dashboards and alert rules are produced by small scripts and committed, so the same dashboards can be rebuilt on a new server.
- **Documentation as code.** A private repository holds the architecture, an inventory, a runbook, a change log with *how to undo* every change, and a to-do list kept as issues with labels. More on this below.
One lesson about upgrades: do them **one major version at a time**, with the tags pinned, and test between steps. Skipping versions on a stateful app is how you learn about migrations the hard way.
# 6. One login for everything
Early on, every service had its own accounts and passwords. That is a mess for a team: onboarding means six accounts, offboarding means six places to forget one.
So I deployed **authentik** as the single identity provider and connected every service to it with OpenID Connect:
- **Invitation-only registration.** Nobody can sign themselves up; an admin sends an invite.
- **Groups decide roles.** An `admins` group makes someone an admin in the services that support it; a `dev` group controls who even sees the code-hosting app.
- **Services without native SSO** (the video meetings, some admin tools) get a small adapter or sit behind an authentication gate in front of them.
- **Multi-factor authentication is mandatory for admins.** If you are an admin and have no second factor, you are sent to set one up at your next login.
- **Local break-glass logins stay.** If the identity provider is down, I can still get in. A single point of failure for authentication needs an escape hatch.
The unglamorous part was **migrating existing accounts**: people already had a chat account, a file account, a git account. Linking each of them to the new identity without losing their history took more care than the SSO itself.
# 7. Seeing everything: logs, dashboards, alerts
At first, monitoring was an afterthought. I now think it should come right after the network.
- **Six months of logs.** Firewall events, connection attempts, and access logs go to a log store and stay for half a year. When someone asks "who connected to what, and when?", I can answer.
- **Per-person VPN logs.** VPN connections are logged under the account holder's name, so an incident can be traced to a person and a device rather than "someone on the VPN". We are open with the team about this.
- **Dashboards that answer questions.** Traffic per machine (up and down, especially to and from the internet), resource use per machine (CPU, RAM, disk, network), a security view (login attempts, scans, blocked spoofing) and an "internal network and VPN" view of who used what.
- **Alerts that explain themselves.** An alert that only says "something is wrong" is not enough at 3 a.m. Mine say *what* happened, name the *root* (the attacker's address, the machine, the container), say what to check first, and what to do next.
The paragraph I would rather not write, but should: **before this monitoring existed, one of the machines we hosted for a teammate was compromised and used to mine cryptocurrency.** We found out the hard way, and because there were no logs from that time, we could not tell how it started. That single incident justified every hour I later spent on logging. Visibility is not a luxury you add later; the day you need it is the day it is too late to have it.
# 8. Documentation is part of the system
A one-person infrastructure has a bus factor of one, and that person is tired. So I write everything down, in a private repository:
- **Architecture**, with diagrams, and an **inventory** of what runs where.
- A **runbook**: how to do the common things, and how to recover when they go wrong.
- A **change log** where every change records *what, why, and how to undo it*.
- **Issues for everything not done yet**, with labels so I can see by topic what is open.
Writing the "how to undo" line forces me to think about rollback before I need it. It has saved me several times.
# 9. Mistakes I made (so you do not have to)
- **I locked myself out.** I tightened an access rule without keeping a second way in. Now every risky network change has two independent paths in and an **automatic rollback timer** armed before I start.
- **I broke the internet for the internal network** by turning on a firewall feature that changes how the bridge behaves. It was fixed by a prepared rollback, and the lesson went into the runbook: test the real path (internal to internet), not only the inbound one.
- **I took the dashboards down with a config typo.** A single invalid field in an alert definition made the monitoring service refuse to start and restart in a loop. Now alert changes go through a script that checks the service is healthy afterwards and restores the last good file if not. I also learned to validate alerts through the tool's own API, not only by testing the underlying query.
- **I over-reserved storage.** Every virtual disk was allocated in full up front, so the server looked "almost full" while most of the space was reserved but unused. Thin provisioning and a retention policy for backups are on the list.
- **I trusted defaults.** A reverse-proxy default, a DNS default, a "latest" tag. Each one cost me an evening.
None of these were catastrophic, because of snapshots, backups, and the habit of writing the undo step first.
# 10. What I would do differently
- **Infrastructure as code from the start.** I documented a lot, but I would now provision with a tool like Ansible so the whole server could be rebuilt from a repository.
- **Test restores, not just backups.** A backup you have never restored is a hope, not a backup.
- **Monitoring and logging first.** Before any service goes live.
- **A second machine somewhere else.** One server is great until it is not.
- **Notifications.** Alerts you only see when you open a dashboard are half of what you need.
# 11. Takeaways
1. **Design the network before the services.** Zones, one door in, default deny.
2. **Snapshot before every change,** and write the undo step first.
3. **One identity for everything,** with mandatory MFA for admins and a break-glass path.
4. **Log early, keep it long,** and make alerts explain themselves.
5. **Write it down.** The person you are protecting is future you.
6. **Boring technology wins.** Compose files and plain configuration beat clever setups when you are the only operator.
7. **Be honest about incidents.** Each mistake above taught me something that made the system safer.
Building and running this has been the best engineering education I could ask for, and it keeps paying back: every new teammate gets one login, one VPN, and a place to work on day one. If you are a founder weighing a rented server against a pile of subscriptions, the real question is not the monthly price. It is whether you are willing to be the person who answers when it breaks. I was, and I would do it again.
---
# Nunya: Building an Honest, Open-Source VPN Client
- URL: https://alinaderiparizi.com/project/nunya/vpn/open-source/rust/tauri/2026/10/04/nunya-vpn-client.html
- Date: 2026-10-04
- Kind: Project
- Topics: nunya, vpn, open-source, rust, tauri
- Code: https://github.com/nunyavpn/nunya
- Summary: Nunya is a free, open-source VPN client for macOS, Windows and Linux. It is live at nunya-vpn.com; this post covers the idea behind it, how it is built, and what it took to turn a fork into a real beta.
[Nunya](https://nunya-vpn.com/) is live now: a free, open-source desktop VPN client for macOS, Windows and Linux. You give it the servers you already have, a single share link, a subscription with hundreds of configs, or a WireGuard file, and it connects you through them. It has no account, no telemetry, and the code is GPL-3.0.
Nunya connected through a server in Helsinki: the server list, the route on the map, and the status card with live traffic. The servers are made-up examples.
This post is about three things: the idea, how the app is put together, and what it took to build it like a professional open-source product rather than a weekend hack. The last part is the one I'm proudest of.
# 1. The idea
If you live somewhere with a filtered internet, a VPN client is not a nice-to-have; it is how you reach half the web. Most people around me do not buy a "VPN product". They get VLESS, VMess, Trojan or WireGuard links from a friend or a seller, or a subscription URL from a panel, and paste them into whatever client works this month.
Those clients are powerful, but they have two problems:
1. **They are built for people who already understand them.** Inbounds, outbounds, routing tables, core selection. Great for power users, confusing for everyone else.
2. **They say more than they know.** A green "Connected" usually means *a process started*, not *your traffic is actually getting through*. A server labelled "Germany" might exit in the Netherlands, or be fronted by Cloudflare and exit somewhere else entirely.
So Nunya's promise fits in five words: **safe, fast, reliable, secure, easy**. Behind all five is one rule: **the app never claims more than it can prove.**
- A server only counts as working if traffic actually passes through it end to end.
- A server's flag comes from where its traffic really exits, not from its name. For a Cloudflare-fronted server, Nunya asks Cloudflare which data center your network actually reaches.
- The shield turns red when the tunnel is up but nothing comes out of it.
- In proxy mode, the app tells you exactly which apps are covered and which are not. It only says "protected" when the whole device is in the tunnel.
# 2. What it does
- **Two ways to connect.** *VPN mode* carries the whole machine through a TUN device. *Proxy mode* opens a local SOCKS/HTTP port and can set it as the system proxy, then puts your original settings back when you disconnect.
- **One box for every link.** VLESS, VMess, Trojan, WireGuard and Cloudflare WARP; TCP, WebSocket, gRPC, HTTP/2, HTTPUpgrade, QUIC and XHTTP; TLS, Reality, uTLS fingerprints and ALPN. Subscriptions can arrive as link lists or as Xray, sing-box or Clash configs. QR codes work too.
- **Quick Connect** to the fastest, most used or most recent server.
- **Usage history** per server and per subscription, next to what your provider reports.
- **Sharing** a server as a link, a QR code, or a WireGuard config the official apps can scan.
- **Ad blocker, anti-tracker and bypass rules** while you are connected.
- **A menu-bar shield** on macOS and Linux that connects and disconnects without opening the window.
- **Self-updating**, with signed releases and a beta channel.
The menu-bar popover, sharing a server, and per-server usage.
# 3. How it is built
Nunya lives in two public repositories under the [nunyavpn](https://github.com/nunyavpn) organization. Both started as forks of [Throne](https://github.com/throneproj/Throne) (itself a descendant of NekoRay), and both stay GPL-3.0 like their ancestors.
| Repo | What it is | Stack |
| --- | --- | --- |
| [nunya](https://github.com/nunyavpn/nunya) | the app you install | Tauri v2: TypeScript UI, Rust shell, Swift tunnel extension on macOS |
| [nunya-core](https://github.com/nunyavpn/nunya-core) | the network engine | Go, wrapping [sing-box](https://github.com/SagerNet/sing-box) and [Xray](https://github.com/XTLS/Xray-core) |
## 3.1 Two repos, one pinned contract
The app never builds the core. It pins a core release in a `core.lock` file, together with the SHA-256 of that release's `SHA256SUMS`. One digest makes the whole set of binaries tamper-evident: if a release is ever re-cut, the fetch script fails instead of installing it.
The interface between the two is a single protobuf file, `nunya.proto`, which ships as a release asset. Go generates its handlers from it; Rust generates its bindings from the same file. A client pinned to a tag cannot be built against a contract it did not pin.
## 3.2 An IPC that trusts nobody
Despite the `service` block in the proto, nothing on the wire is gRPC. It is two tiny little-endian frames over a Unix socket, or a named pipe on Windows:
```text
request [u32 id][u16 method_len][method][u32 payload_len][protobuf]
response [u32 id][u8 status ][u32 payload_len][protobuf or error text]
```
The interesting part is who trusts whom. The GUI listens and the core dials in, and **both ends verify each other**. The core checks that the process it is talking to is its own parent, a binary named exactly `Nunya` sitting next to it. The app checks that the peer on the socket is the child it just spawned. Without that second check, any local process that won the race to the socket could pretend to be the core and report a healthy tunnel that does not exist, which is exactly the kind of lie Nunya exists to avoid.
## 3.3 No frontend framework, on purpose
The UI is plain TypeScript. The whole "framework" is `dom.ts`: `h`, `render`, `qs`. State lives in one store, and every mutation goes through `store.update()`, which persists and notifies in one place, so no view can change state without the rest of the app hearing about it. That is the Redux pattern without Redux.
Why? Because in a VPN client *every shipped byte is something a user has to trust*. A handful of screens and one list that refreshes do not justify a dependency tree. We considered React and Tailwind, rejected both, and wrote down why, so nobody has to rediscover the reasoning.
## 3.4 Reject by name, never silently downgrade
This is my favorite rule in the codebase. If a share link uses a transport the core cannot run, Nunya refuses it and says why. The easy thing would be to quietly treat it as TCP; the core would accept the config and you would get a tunnel that comes up and never passes a single packet.
Same with subscriptions. A panel might serve a list of links, or a whole Xray, sing-box or Clash config, and no HTTP header tells you which. Nunya reads each format with its own reader, but they all feed **one writer** that turns a server into a share link, so the three formats of the same subscription import the same servers. There is a test for exactly that, and it held against a real panel.
## 3.5 VPN mode on macOS before a signed NetworkExtension
The proper way to do VPN on macOS is a NetworkExtension, the same thing WireGuard and Tailscale use. That needs a paid Apple Developer account to sign. Until then, Nunya gets VPN mode through a setuid-root core: one administrator prompt, then `chown root:wheel` and `chmod 4755` on the bundled core. Two details matter:
- The app **explains the password prompt before macOS shows it**. An unexplained password dialog from a VPN app reads as an attack.
- Only a core sitting next to `Nunya` is ever granted root, and release builds refuse to bundle a core with the parent check turned off. A root-capable binary that anything local could drive would be a gift to malware.
# 4. Building it like a real open-source project
The part of this project I enjoyed most was not a feature. It was treating a one-person project as if a team would inherit it tomorrow.
**Every merge to `main` is a release.** A `feat:` PR title bumps the minor version, anything else bumps the patch. CI computes the version, builds for macOS, Windows and Linux, publishes a beta with checksums, and commits the version back. Stable versions are a tag a person pushes. Nobody bumps a version by hand, ever.
**Issue -> branch -> PR, even alone.** Every change starts as an issue, lands as a squash-merged PR with a conventional title, and the PR title is the changelog.
**Comments explain why, not what.** Every module opens with a short header: the decision, and the alternative that was rejected. It is the codebase's defining habit, and it makes reviewing and returning to the code far easier.
**Tests are sentences.** `the_tunnel_takes_the_default_route_and_gives_it_back`. There are around 200 Rust tests plus frontend tests, and the important ones run against a real core: every transport the app can emit is fed to an actual nunya-core to prove it is accepted, because the shapes differ in ways a unit test cannot see. The Linux tunnel tests run in a container with `CAP_NET_ADMIN`, so they need no root on the host.
**Docs for two audiences.** The [website](https://nunya-vpn.com/) and README are for users: what it does, how to install it, and how to check a download. `CONTRIBUTING.md` and `ENGINEERING_STANDARDS.md` are for developers: how to build, how to release, where to split a module when it grows, and which proposals were already rejected.
**Refactor before it hurts.** Once `main.ts` got big, I split it along its real responsibilities: tunnel, add-servers, throughput, and each sheet. Each PR was reviewable on its own, instead of becoming one heroic rewrite.
**Security is in the defaults.** The data file holding your server credentials is written like a key file: owner-only, replaced atomically, and a corrupt file is an error, never a silent reset. Subscriptions are fetched in Rust, not in the webview, because a subscription URL is a credential and should not sit in a browser network log. `http://` subscriptions are refused before any request is made.
# 5. Where it is going
Nunya is live at [nunya-vpn.com](https://nunya-vpn.com/) and already my daily driver. Next up:
- More protocols: Shadowsocks, Hysteria2, TUIC, SSH, AmneziaWG, and proxy chains.
- VPN mode out of the box on every platform, with no administrator step, which on macOS means a signed NetworkExtension.
- Creating Cloudflare WARP configs from inside the app.
- The server side: **nunya-server-core** (Docker), **nunya-cluster** and a **nunya-server-panel** for config and user management.
# 6. Try it, break it, contribute
Start at [nunya-vpn.com](https://nunya-vpn.com/). Builds for macOS, Windows and Linux are on the [Releases](https://github.com/nunyavpn/nunya/releases) page, each with a `SHA256SUMS` to check your download against. Bug reports, ideas and pull requests are welcome in the [issues](https://github.com/nunyavpn/nunya/issues). If you have ever pressed "Connect" and wondered whether it actually did anything, this app is for you.
---
# EzIELTS: The Idea, the AI Tutor, and the Plan
- URL: https://alinaderiparizi.com/blog/introducing-ezielts/
- Date: 2026-10-04
- Kind: Blog post
- Topics: ezielts, ai, education
- Summary: Introducing EzIELTS: an IELTS preparation project built around an AI tutor, useful feedback, and regular practice. Here is the proposed roadmap, why we will use the OpenAI API, and what we are considering for voice conversations.
We are working on **EzIELTS**, an IELTS preparation project with an AI tutor at its center. The idea is to make regular practice easier to keep up with: give learners a place to work, ask questions, receive feedback, and decide what to practice next.
This is an introduction to the project and the direction we want to take it. The features below describe the proposed plan, rather than a list of things that have already shipped.
## Why we want to build it
Studying can leave you with a very practical question: *what should I work on next?* You can write an essay or record an answer, but identifying the useful next step takes more than collecting another exercise.
That is the experience we want EzIELTS to support. A learner should be able to finish a practice session with something specific to improve, an explanation they understand, and a chance to try again.
For example, feedback on an essay could point to a paragraph whose main idea is unclear, explain why it is difficult to follow, and ask the learner to rewrite it. The value is in that second attempt and what the learner takes away from it.
## What EzIELTS is
The proposed product is an IELTS study companion built around a simple loop:
**Practice, get feedback, work on a weakness, and try again.**
We want that loop to connect several parts of the learning experience:
- **An AI tutor** for questions, explanations, and guided exercises.
- **Writing practice** with feedback tied to the learner's own answer and opportunities to revise it.
- **Speaking practice** through conversations with a voice assistant.
- **A study plan** shaped by the learner's goals and the areas they need to work on.
- **Progress tracking** that lets learners revisit earlier attempts and see what has changed.
Reading and listening practice could extend the same experience later. The first version should give us enough focus to learn whether the tutoring and feedback actually help.
## The AI tutor: OpenAI API
We will use the **OpenAI API** to power the AI tutor. We want learners to be able to ask follow-up questions, request a simpler explanation, and work through an exercise rather than receive one answer and move on.
The tutor should use the relevant context from a practice session. If a learner is revising an essay, it should be able to discuss that essay and the feedback already given. If the same mistake keeps appearing, it should help the learner practice that particular skill.
The engineering work will include deciding what context to send, structuring the feedback, and evaluating whether the explanations are accurate and useful. We have not selected a specific model yet; that choice will depend on the quality, response time, and cost we see in our own tests.
We also want to be careful about assessment. Any score estimate we introduce should be clearly presented as practice feedback, with an explanation of its limits. It should help someone study, without promising an exam result.
## The voice assistant: ElevenLabs or OpenAI
Speaking practice is one of the parts I am most interested in. The goal is a conversation where the learner can answer aloud, respond to follow-up questions, and review feedback afterward.
We are considering **ElevenLabs or OpenAI** for the voice assistant. The provider is still an open decision.
[OpenAI's Realtime API](https://developers.openai.com/api/docs/guides/realtime) supports speech-to-speech interactions. [ElevenLabs' conversational agent platform](https://elevenlabs.io/docs/eleven-agents/build/overview) offers tools for building voice agents. We will prototype the options against the speaking experience we want to deliver.
The comparison needs to cover more than how pleasant a voice sounds. We need to test response delays, interruptions, how well the system understands learners, and the cost of a complete practice session. A speaking tutor also needs to give someone time to think and finish an answer.
## The technology plan
The technology decisions currently look like this:
| Part | Current plan |
| --- | --- |
| AI tutor | OpenAI API |
| Voice conversations | Evaluate ElevenLabs and OpenAI |
| User interface | Platform and frontend stack still to be selected |
| Application backend | Stack still to be selected; will manage sessions and AI integrations |
| Persistent storage | Database still to be selected for goals, practice history, and feedback |
| Deployment | Hosting still to be selected |
The application will need to manage provider credentials securely, control API usage, and make clear what information is sent to the AI services. Essays, conversation transcripts, and recordings also need deliberate decisions about storage and deletion.
We will choose the remaining stack as the first version becomes more concrete. At this stage, the important technical commitment is the OpenAI-powered tutor, with a voice integration to follow once we have tested the alternatives.
## The proposed roadmap
**First, build a useful tutoring loop.** Start with text conversations and writing practice: submit an answer, receive feedback, ask questions, and revise. This gives us a manageable way to test the quality of the tutoring experience.
**Then, add speaking practice.** Prototype the voice providers, choose an approach, and connect spoken practice to feedback and review. We should test it with learners before expanding the feature set.
**Next, connect sessions into a study plan.** Use practice history to help learners choose their next exercise and revisit areas that still need work. Progress tracking should make those decisions easier.
**Finally, broaden the preparation experience.** Add more practice material and consider reading, listening, and longer mock sessions as we learn what users need. There is no announced launch date yet.
## What we want to get right
The question we will keep returning to is simple: after using EzIELTS, does the learner know what to practice next, and can they put the feedback into action?
That is the project we want to build. An AI tutor gives us a starting point; useful exercises, thoughtful feedback, and regular practice will determine whether EzIELTS earns a place in someone's study routine.
---
# Introducing JoME: Building a Smart Irrigation System
- URL: https://alinaderiparizi.com/blog/introducing-jome/
- Date: 2026-10-02
- Kind: Blog post
- Topics: embedded, iot, irrigation
- Code: https://github.com/jome-farmer
- Summary: Inside JoME: an ESP32 irrigation controller, a mobile app, a Python backend, and a shared device protocol. What works today, how it is built, and what comes next.
I’m building **JoME**, a smart irrigation system for home gardens, urban gardens, and greenhouses. The idea is straightforward: set up watering zones, give them a schedule, and let the controller handle the actual watering. Use the app to see what is happening, change a program, or run a zone when it needs attention.
The longer-term goal is to bring watering, sensing, and garden advice together: a system that can help decide what plants need as well as switch a valve. Getting there means building the physical controller, its firmware, the mobile app, and the services connecting them.
This is a progress report as of **2 October 2026**. JoME is in development, with a working local-control implementation and an evolving cloud path. The AI assistant is currently a preview, and the custom hardware shown below is a concept.
Visit the [JoME landing page](https://jome-farmer.ir/) or explore the [web app](https://app.jome-farmer.ir/) using **Try the demo**.
Controller and enclosure concept. This render illustrates the intended direction; the current firmware targets an ESP32 development board.
## What does JoME do?
An irrigation system has physical valves and pumps. JoME gives them a more useful vocabulary: **zones** such as vegetable beds, fruit trees, or a lawn, and **programs** that water those zones in sequence on selected days.
The controller runs the programs itself. A phone is useful for setup and control, but it does not have to stay awake to trigger every watering step. A rain delay pauses scheduled watering, and manual controls let the user start or stop a zone.
The current implementation also reads board temperature and a flow sensor. Flow measurements make it possible to record litres used during a watering run, rather than keeping only a timer. More advanced responses to sensor readings, weather, and soil conditions are part of the work ahead.
## The parts of the project
JoME is split across a few repositories with distinct responsibilities:
| Part | Role | Implementation |
| --- | --- | --- |
| [JoME app](https://github.com/jome-farmer/JoME) | Setup, zone control, schedules, device status, terminal, and assistant UI | React, TypeScript, Vite, Capacitor |
| [SHamBE](https://github.com/jome-farmer/SHamBE) | Firmware that operates the irrigation hardware | C++, ESP32, FreeRTOS, PlatformIO |
| [DouSHamBE](https://github.com/jome-farmer/DouSHamBE) | Accounts, device ownership, remote commands, and a cloud copy of device state | Python, FastAPI, MongoDB, Redis, RabbitMQ |
| [Board protocol](https://github.com/jome-farmer/protocol) | Shared contract between the app, firmware, and server | JSON commands, responses, and events |
| [Landing page](https://github.com/jome-farmer/landing) | Public introduction to the project and its direction | Next.js |
There is also [MQute](https://github.com/jome-farmer/MQute), a separate Python MQTT framework experiment. The current DouSHamBE implementation uses its own messaging services with `aiomqtt` and `aio-pika`.
The intended connection paths look like this:
```text
JoME app ── Bluetooth / USB ──► SHamBE controller ──► valves and pumps
│ │
└── HTTPS / event stream ──► DouSHamBE ◄── MQTT over TLS ──┘
```
The local Bluetooth and USB path is implemented. The app and backend have cloud-side components, while the controller’s registration and MQTT connection remain integration work.
## The mobile app
I’m using **React 19 and TypeScript**, packaged for Android and iOS with **Capacitor 8**. The same application also runs in the browser, which makes it useful for development and testing alongside the phone builds.
The main screens cover the everyday tasks:
- **Home:** controller status, the next watering program, quick actions, and water usage.
- **Zones:** named watering areas, their valve mappings, and manual run controls.
- **Schedule:** weekly programs containing a sequence of zones and durations.
- **Device:** connection details, settings, and access to the diagnostic terminal.
- **Ask JoME:** the assistant interface, currently backed by a scripted preview.
HomeZonesSchedule
These are screenshots of the running web app at a phone-sized viewport, using its simulated controller. The garden names, readings, and programs are demo data.
### One device client, several connections
The app talks to a `DeviceClient` that sends requests and matches responses by their IDs. Beneath it, a small `Link` interface handles bytes. Bluetooth, USB, the demo controller, and the cloud adapter implement that same interface, so zone and schedule screens can share the command path.
Bluetooth is available through the native phone integration and Web Bluetooth in supported desktop browsers. USB uses Web Serial on desktop and a native USB serial bridge on Android. iOS uses Bluetooth for local access.
Shared application state lives in Redux Toolkit: account state, connection state, and one garden snapshot used by the screens. A disconnected board should not leave the app pretending that an old snapshot is live.
## Inside the controller
The current firmware runs on an **ESP32 development board**. A **PCF8575 I²C expander** provides up to 16 relay channels for valves and pumps. The prototype also includes an **SSD1306 OLED**, an **LM35 temperature sensor**, and a **YF-B6 flow sensor**. A SIM900 modem has been brought up for boot-time SMS notifications; full cellular connectivity is still future work.
The firmware separates hardware drivers from irrigation logic. The application works with interfaces for relays, storage, displays, and sensors; the ESP32-specific drivers sit underneath. This lets me test irrigation decisions on a computer and gives a future custom board a clear place to connect.
### Watering and safety
The irrigation core models valves and pumps and checks that a pump has an associated open valve before starting it. The scheduler stores programs on the controller, runs their steps, respects rain delay, and includes logic for resuming a program after a restart. The clock can synchronize through NTP when Wi-Fi is connected.
Configuration uses NVS and LittleFS. File updates use a temporary file followed by a rename, and persistence failures must be reported rather than acknowledged as successful saves. Flow pulses are converted using a calibration factor, and each zone run’s litres and duration go into a 90-day usage log.
There are native tests for the portable logic and a separate on-device test tier for drivers, storage, and task behavior. Passing desktop tests is one part of validation; wiring, calibration, and recovery still need checks on real hardware.
### A shared command language
The [protocol repository](https://github.com/jome-farmer/protocol/blob/main/protocol.md) defines commands such as `zone.run`, `program.save`, and `sensors.read`. Over Bluetooth and USB, requests and responses are newline-delimited JSON. The `hello` response advertises the commands a board supports, so clients can check capabilities before calling them.
For example, a local request to run zone 1 for ten minutes is:
```json
{"id":1,"cmd":"zone.run","args":{"zone":1,"seconds":600}}
```
The contract also defines the future MQTT transport. Keeping one command vocabulary across connections helps prevent the phone app and remote-control service from developing different meanings for the same action.
## The backend and remote access
**DouSHamBE** provides the server side of device registration, ownership, sharing, and remote access. It uses FastAPI for HTTP endpoints, MongoDB for persistent records, Redis for coordination, and RabbitMQ for messaging and the device broker path. The app currently offers Google sign-in.
The backend maintains a cloud copy of device state. The controller remains the authority for what is actually running; an offline snapshot needs an age and an offline indication, so it cannot be mistaken for a fresh reading.
The registration design uses a short-lived user token passed locally to the board. The board is intended to generate its own key pair, request a client certificate over HTTPS, and connect to the broker with mutual TLS. Server-side support is implemented, but the corresponding firmware path is still planned. I’m treating end-to-end remote control as unfinished until those pieces work together on hardware.
## Where the AI assistant stands
The assistant UI and its device-action boundary are implemented. Read operations can inspect the controller, stop operations can close water immediately, and actions that start watering or change a program require the user to tap **Confirm**.
The current assistant is a **scripted preview**. It exercises the chat flow and action cards using controller data. Connecting a real agriculture model and external knowledge sources is future work; the preview does not demonstrate trained-model performance, plant diagnosis, or weather-driven automation.
Assistant preview in the running app, using the simulated garden.
## Where I am now
I’m at the **prototype and integration stage**, ahead of the original design-only milestone but still working toward a complete release.
| Area | Current stage |
| --- | --- |
| Local controller | BLE/USB commands, zone control, on-board schedules, OLED status, temperature, flow readings, and usage logging implemented |
| App | Core screens, demo mode, local links, cloud adapter, Google sign-in, and Android/iOS project setup implemented |
| Backend | Account and device services, state mirroring, messaging, certificate services, and deployment automation implemented |
| End-to-end cloud connection | Board registration and MQTT firmware integration still pending |
| AI | Assistant UI and confirmation rules implemented; real agent integration pending |
| Custom hardware | Concept stage; firmware currently targets the development-board setup |
My next priorities are completing the board-to-server path, validating the whole system on real hardware, and finishing release checks for the mobile builds. More advanced sensing, plant advice, and nutrient delivery belong to the longer-term direction.
I want the foundation to be dependable: the controller follows a schedule, the app shows its actual state, and a failed connection or failed save is visible. That is the base the more ambitious parts of JoME will build on.
## Follow the project
- [JoME landing page](https://jome-farmer.ir/)
- [Try the JoME web app](https://app.jome-farmer.ir/) — choose **Try the demo** to explore without hardware.
- [JoME on GitHub](https://github.com/jome-farmer) — app, firmware, backend, protocol, and related work.
---
# Case Study: Engineering Passwordless Authentication at IDmelon
- URL: https://alinaderiparizi.com/blog/authentication/fido2/security/windows/2026/09/28/idmelon-passwordless-authentication.html
- Date: 2026-09-28
- Kind: Blog post
- Topics: authentication, fido2, security, windows
- Summary: Two years building FIDO2 passwordless authentication at IDmelon, from R&D and prototypes to the first production release, and then leading the engineering team. With one component in depth: Windows sign-in with a security key for local accounts.
From 2022 to 2024 I worked at [IDmelon](https://idmelon.com), a Vancouver company building passwordless authentication on the FIDO2 standard. I was involved from the product's earliest stages and worked on it along the whole path from research to a product in production: the R&D, the prototypes, the demos, the first production version, the iterations after it, and later leading the engineering team that built it.
This page is about what I did there and how. It stays at the architecture level: nothing here is proprietary.
# Context
A password is a shared secret: the user knows it, the server stores something derived from it, and anyone who phishes or leaks it can use it. FIDO2 replaces it with public-key cryptography. An **authenticator** (a security key, or a phone acting as one) creates a key pair per site; the site stores only the public key. To sign in, the site sends a random challenge and the authenticator signs it with the private key, which never leaves the device. There is nothing reusable to phish or leak.
The standard handles the cryptography. The engineering problem is everything around it: getting real operating systems, applications and people to use it, reliably, every day.
# My role
- **R&D and prototypes.** I did the initial R&D, built the early prototypes, and presented and demonstrated them.
- **First production version.** I built the first production version, then kept improving it as it met real use.
- **Components and architecture.** I designed and implemented major technical components, and helped evolve the architecture as the product matured.
- **Leadership.** I led the engineering team, trained and mentored junior engineers, and worked closely with QC on quality.
My responsibilities grew with the product: from building the first working thing, to making it production-grade, to leading the people building it.
# From R&D to production
```text
research ─► prototype ─► demonstration ─► first production version ─► iteration in production ─► leading the team
```
Each step changes what "done" means. A prototype has to prove the idea in a demo. A production version has to work on machines you've never seen, fail safely, and be diagnosable when it doesn't. Iteration means taking what QC and users find and folding it back in without breaking what already works.
# In depth: Windows sign-in with a security key
One component shows the path well. At the time, Windows 10 supported signing in with a FIDO security key only for business accounts; people signing in to a **local** account couldn't use one at all. I designed and built the missing piece: sign-in to Windows with IDmelon, or any other FIDO2 security key, for local accounts.
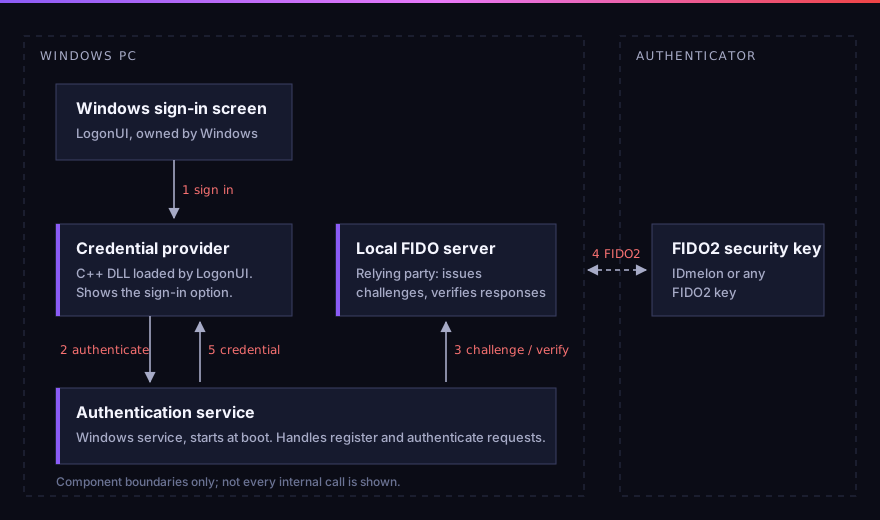
It has three parts:
1. **A credential provider** (a C++ DLL). Windows loads credential providers into its sign-in screen; ours adds an IDmelon sign-in option for users who have registered a key. It's deliberately small: a sign-in button, and a call to the service.
2. **An authentication service** (a Windows service that starts at boot). It handles two requests, *register* and *authenticate*. When a user is authenticated with their key, it returns a Windows credential to the credential provider, which hands it to the sign-in screen.
3. **A local FIDO server.** FIDO2 always needs a relying party to issue challenges and verify the signed responses. With no web server in the picture, the relying party runs locally.
The split keeps the code that runs inside Windows' own sign-in screen minimal; the authentication work lives in a separate service. The first working version took about a week.
# Production and quality
Getting from "works on my machine" to "works in production" was a large part of the job. I worked closely with QC to identify, reproduce, diagnose and fix bugs. Authentication is unforgiving here: a sign-in bug doesn't degrade the experience, it locks someone out of their computer.
# Leadership
As the product matured I led the engineering team: designing and implementing major components, helping evolve the architecture, and training and mentoring junior engineers.
# Outcome
The technology went from R&D and prototypes to production authentication products that kept developing as part of a real security company. IDmelon later became part of HID.
# Related
- [Smart Card: An Introduction to smart card development](https://alinaderiparizi.com/blog/embeded/smart-card/2023/07/19/smart-card-intro.html) and [Building Your First Applet with jCardSim](https://alinaderiparizi.com/blog/embeded/smart-card/2026/09/04/smart-card-dev.html): my own series on the hardware side of the same idea, building a FIDO security key on a Java Card, step by step.
---
# latex-academic-template: create-react-app for LaTeX
- URL: https://alinaderiparizi.com/blog/latex/docker/devtools/cli/2026/09/24/latex-academic-template.html
- Date: 2026-09-24
- Kind: Blog post
- Topics: latex, docker, devtools, cli
- Code: https://github.com/mralinp/latex-academic-template
- Summary: A Dockerized LaTeX template gallery with a create-react-app-style scaffolding wizard: pick a template, import an Overleaf .zip or git URL, and get a ready-to-build project in one command. No local LaTeX install, ever.
[latex-academic-template](https://github.com/mralinp/latex-academic-template) started as the repo behind my own resume and turned into something more useful: a Dockerized LaTeX template gallery with a one-command scaffolding tool. No TeX Live install, no `tlmgr`, no losing an afternoon to a broken package manager. Getting from nothing to a compiling PDF is one command:
```bash
bash -c "$(curl -fsSL https://raw.githubusercontent.com/mralinp/latex-academic-template/main/create-latex-app.sh)"
```
This post is about why it exists, how the scaffolding wizard actually works, and two shell gotchas that only showed up once I stopped reading the script and started actually running it.
# 1. Why
Every LaTeX document I write starts the same way: clone some old project, delete the content, keep the `\usepackage` block, and hope the machine I'm on still has the right TeX Live scheme installed. A full `scheme-full` install is several gigabytes and drifts out of sync between my laptop, my desktop, and CI the moment any of them updates independently. None of that has anything to do with actually writing the document.
The fix is the same one I already use for everything else: don't install the toolchain, run it in a container. `docker-compose.yml` pulls the official [`texlive/texlive`](https://hub.docker.com/r/texlive/texlive) image, and a `Makefile` on top of it does the rest. The only two things a clone of this repo needs on the host machine are Docker and `make`, both of which are already sitting on any machine I do real work on.
# 2. The gallery
The repo is a `templates/` directory, one folder per document type, each with a `main.tex` and a small `config.mk` (engine, entry file, whether `-shell-escape` is needed). Three live there today:
- **resume** -- a single-column CV with a contact-icon header built on `paracol` and `fontawesome5`.
- **ieee-transactions** -- the actual [IEEE Transactions on Medical Imaging](https://www.embs.org/tmi/) author kit (`ieeecolor.cls` + `tmi.sty`), vendored directly since it isn't on CTAN.
- **springer-lncs** -- a Springer Lecture Notes in Computer Science proceedings skeleton.
Both the resume and the IEEE template used to be real content before I stripped them down. The IEEE one is a genericized version of the actual TMI draft for my [spherical-harmonics ABUS work](https://alinaderiparizi.com/project/abus-classification/medical-imaging/ultrasound/mammography/breast-cancer/2026/09/16/abus-classification-1-imaging-modalities.html); the class files, the footnote block, the `IEEEkeywords` environment, all of it came straight out of a real submission. Turning a working document into a template is a good forcing function: anything left in the placeholder version is there because it's structurally useful, not because I forgot to delete it.
Adding a template is meant to be trivial:
```bash
make add-template NAME=ieee-conference
```
scaffolds `main.tex` and `config.mk`, and from that point it's picked up automatically by `make list`, `make build-all`, and the gallery page. No registry file to edit.
# 3. The `create-react-app` part
The gallery on its own still meant cloning (or forking, or "Use this template"-ing) the whole multi-template repo just to write one document -- correct, but not what most people actually want. What they want is closer to `npx create-react-app my-app`: one command, a couple of prompts, a working project. So `create-latex-app.sh` exists to do exactly that:
```bash
bash -c "$(curl -fsSL https://raw.githubusercontent.com/mralinp/latex-academic-template/main/create-latex-app.sh)"
```
It's a plain bash script (bash 3.2-compatible, since that's what macOS still ships), and it asks three things: a project name, then one of
- **a gallery template** (resume, IEEE, Springer, ...),
- **a local `.zip`**, e.g. exported straight out of Overleaf, or
- **a git URL**, e.g. an Overleaf project's git remote,
and hands back a standalone folder with its own minimal `Makefile`, `docker-compose.yml`, and a fresh git repo with an initial commit, offering to run the first build immediately. For the `.zip`/git-import paths it also auto-detects the entry `.tex` file (first `main.tex` it finds, otherwise the first file with both `\documentclass` and `\begin{document}`) and, if the imported project already has its own `Makefile` or `README`, backs the originals up instead of silently overwriting them.
It also runs locally as `make create` for anyone already sitting inside a clone.
# 4. Two bugs that only existed at runtime
**A source that hadn't fully synced produced a fake success.** Early on I tested the script against the just-pushed repo before the push had actually landed, so the temp clone it made was missing `scaffold/Makefile`. The `cp` failed, the `sed` failed, and the script kept going anyway and printed "Created my-project/" like nothing had happened -- because nothing in it actually checked that the pieces it depended on were there. The fix was a `verify_source()` step, run right after the clone and before anything is written to disk, that fails loudly if the expected files aren't present. Obvious in hindsight; invisible until I ran it against a source that was actually broken instead of one I'd manually pre-verified.
**`bash -c "$(curl ...)" arg1 arg2` doesn't do what it looks like it does.** The README's documented one-liner works fine with no arguments. The moment I tried to pass flags through it the same way --
```bash
bash -c "$(curl -fsSL .../create-latex-app.sh)" my-cv --template resume
```
-- it hung. Turns out `bash -c command_string arg0 arg1 ...` assigns the *first* trailing argument to `$0`, not `$1`. `my-cv` silently became the script's `$0` and vanished; the actual arguments the script saw were just `--template resume`, so the project name was never set, and it sat blocked on a `read` prompt that had no terminal left to answer it, since stdin had already been consumed by the command substitution. The fix isn't in the script -- it's a documentation problem, the same one `rustup` and a few other curl-installers solve the same way: pass a throwaway placeholder for `$0`.
```bash
bash -c "$(curl -fsSL .../create-latex-app.sh)" _ my-cv --template resume
```
Neither of these would have surfaced from reading the script. They only showed up once I ran the exact commands I was telling people to run, against the actual published repo instead of a local copy.
# 5. What's next
The Makefile is deliberately more than `build`: `watch` (`latexmk -pvc`), `lint` (`chktex`), `wordcount` (`texcount`), `clean`/`clean-all`, `shell` to drop into the container directly. CI builds every template on every push, and a GitHub Pages workflow renders a thumbnail of each one's first page and republishes the gallery you see above -- all inside the same container, so the preview is never out of sync with what `make build` actually produces.
The template list is intentionally short right now. IEEE Transactions and Springer LNCS were the two I actually needed; more will show up the same way those did, as real documents that get stripped down once they're not needed as drafts anymore.
If you want a LaTeX document without installing LaTeX, `bash -c "$(curl -fsSL https://raw.githubusercontent.com/mralinp/latex-academic-template/main/create-latex-app.sh)"` and see what it gives you. Issues and template contributions are welcome on [GitHub](https://github.com/mralinp/latex-academic-template).
---
# tdsc-abus2023-pytorch: A PyTorch Dataset for 3D Breast Ultrasound
- URL: https://alinaderiparizi.com/blog/abus-classification/medical-imaging/pytorch/python/2026/09/23/tdsc-abus2023-pytorch.html
- Date: 2026-09-23
- Kind: Blog post
- Topics: abus-classification, medical-imaging, pytorch, python
- Code: https://github.com/mralinp/tdsc-abus2023-pytorch
- Summary: A small pip-installable PyTorch Dataset for the TDSC-ABUS 2023 challenge: what it gives you, the bugs it used to have, and how a memory-mapped cache takes the pain out of loading 200 MB gzip volumes.
[tdsc-abus2023-pytorch](https://github.com/mralinp/tdsc-abus2023-pytorch) is the data layer under my [ABUS classification](https://alinaderiparizi.com/project/abus-classification/medical-imaging/ultrasound/mammography/breast-cancer/2026/09/16/abus-classification-1-imaging-modalities.html) project. It's a PyTorch `Dataset` for the TDSC-ABUS 2023 challenge [1]: 200 automated 3D breast ultrasound volumes, each with a tumor mask, a bounding box, and a malignant/benign label. It's on PyPI, so getting from nothing to a training loop is one line:
```bash
pip install tdsc-abus2023-pytorch
```
This post is about why it exists, what it does, and what I had to fix to make it trustworthy, which turned out to be most of the work.
Case 8 (malignant). (a) Axial slice of the full volume from TDSC, with the tumor mask and bounding box. (b) The same tumor from TDSCTumors, cropped to its bounding box.
# 1. Why a package at all
The challenge data ships as `.nrrd` volumes plus two CSVs per split: `labels.csv` (case id, label, file paths) and `bbx_labels.csv` (bounding-box centre and size). Every project that uses it ends up writing the same glue: download the zips from Google Drive, unzip them, parse the CSVs, read the NRRD files, turn `'M'`/`'B'` into integers, and convert centre-plus-size boxes into corner coordinates. I'd written that glue three times across experiments before I gave up and put it in a package.
The dataset itself is summarized below. Volumes are big, around 843×546×270 to 865×682×354 voxels, and the voxels aren't cubes: about 0.2 × 0.073 mm in-plane and ~0.476 mm between slices.
| Split | Cases | Malignant | Benign |
| ---------- | ----: | --------: | -----: |
| Train | 100 | 58 | 42 |
| Validation | 30 | 17 | 13 |
| Test | 70 | 40 | 30 |
# 2. What you get
Two dataset classes. `TDSC` gives you the full volume:
```python
from tdsc_abus2023_pytorch import TDSC, DataSplits
dataset = TDSC(path="./data", split=DataSplits.TRAIN, download=True)
volume, mask, label, bbox = dataset[0]
```
`label` is `0` for malignant and `1` for benign, and `bbox` is `((x0, y0, z0), (x1, y1, z1))` in the volume's native coordinates. With `download=True`, the split is fetched and extracted on first use. After that it stays on disk and nothing touches the network.
`TDSCTumors` returns the same thing already cropped to the tumor's bounding box. For classification that's usually what you want: the tumor is a small fraction of the volume, and there's no reason to carry the rest of the breast through the pipeline.
```python
from tdsc_abus2023_pytorch import TDSCTumors
dataset = TDSCTumors(path="./data", split="Train", download=True)
volume, mask, label = dataset[0]
```
Transforms are plain callables `(volume, mask) -> (volume, mask)`, applied in order. The only one the package ships is `ViewTransformer`, which transposes the volume into the axial, coronal or sagittal plane. As [Part 1](https://alinaderiparizi.com/project/abus-classification/medical-imaging/ultrasound/mammography/breast-cancer/2026/09/16/abus-classification-1-imaging-modalities.html) explains, the coronal plane is the one handheld ultrasound never captures and the one where spiculation shows up best, so switching views is a one-line change on purpose:
```python
from tdsc_abus2023_pytorch import ViewTransformer, ViewTransposeConfig
dataset = TDSC(
path="./data",
split=DataSplits.TRAIN,
transforms=[ViewTransformer(view=ViewTransposeConfig.CORONAL)],
)
```
The same tumor through each view ViewTransformer produces: (a) axial, (b) coronal, (c) sagittal.
The dependency list is deliberately short: `torch`, `numpy`, `pandas`, `pynrrd` and `gdown`.
# 3. The bugs that were hiding in it
The first version, from March 2025, worked on my machine and for my experiments. When I went back through it properly this month, I found that "worked" was doing a lot of the lifting.
**`TDSCTumors` transformed twice and cropped in the wrong place.** It called the parent's `__getitem__`, which already applied the transforms, then cropped using the bounding box, then applied the transforms *again*. The bounding box is defined in the original coordinate space, so with a `ViewTransformer` in the list the crop was taken from a transposed volume using untransposed coordinates. You got a region of the right size from the wrong part of the breast, and nothing crashed. That's the worst kind of bug in a data pipeline: the model trains, the loss goes down, and the data is wrong. The fix was a `_get_raw_item()` that loads without transforms. `TDSCTumors` now crops first and transforms once, and there's a regression test that fails if either ordering comes back.
**It claimed Python 3.7 support and couldn't import on it.** The type hints used `X | Y` unions, which raise at import time before Python 3.10. A `from __future__ import annotations` fixed that, and the minimum is now an honest 3.9.
**The download metadata was never actually packaged.** The Google Drive file list was bundled with the package, but the code ignored it and fetched a copy from GitHub over HTTP. That relied on `requests`, which was never declared and was only installed because `gdown` pulls it in. Separately, `MANIFEST.in` pointed at a path with hyphens instead of underscores, so the bundled file wasn't in the wheel either. Now it's read with `importlib.resources` and ships with the package.
**The tests downloaded several gigabytes every run.** Every test used `download=True` with nothing mocked, and `pytest.ini` measured coverage of a module named `tdsc` that doesn't exist, so the coverage report was measuring nothing. The suite now builds a tiny synthetic NRRD/CSV dataset in a fixture and runs offline in seconds.
None of these were hard to fix. They were just invisible until I stopped using the code and started reading it.
# 4. Making loading fast
Here's the problem that bothered me most in practice. The volumes are gzip-compressed NRRD, so every `dataset[i]` decompresses roughly 200 MB, even in `TDSCTumors`, where you then throw away almost all of it to keep a crop a few centimetres across. Over many epochs with several DataLoader workers, that's a lot of CPU spent unzipping the same bytes again and again.
The fix is an opt-in `cache=True`:
```python
dataset = TDSCTumors(path="./data", split=DataSplits.TRAIN, cache=True)
loader = torch.utils.data.DataLoader(dataset, batch_size=1, num_workers=4)
```
On first access, each NRRD is decompressed once and saved as an uncompressed `.npy` next to it. Every later read opens that file with `np.load(..., mmap_mode="r")`. That has three effects:
- `TDSC` skips decompression entirely.
- `TDSCTumors` slices the memmap, so the OS only reads the pages under the tumor's bounding box instead of the whole volume.
- DataLoader workers share the OS page cache, so four workers don't mean four private copies of the same volume in RAM.
It costs about 1.5× the NRRD's disk space, which is why it's off by default. The one subtle part is concurrency: several workers can hit the same uncached file at the same moment. Each worker writes to its own `.npy..tmp` and then `os.replace`s it into place. The rename is atomic, so no worker ever memory-maps a half-written file.
```python
if not os.path.exists(npy_path):
volume, _ = nrrd.read(full_path)
tmp_path = f"{npy_path}.{os.getpid()}.tmp"
with open(tmp_path, "wb") as f:
np.save(f, volume)
os.replace(tmp_path, npy_path)
return np.load(npy_path, mmap_mode="r")
```
`TDSCTumors` also copies its crop out of the memmap with `np.array(...)` right away, so the full volume's mapping can be released as soon as the crop is taken, instead of living as long as the sample does.
# 5. Shipping it
The last piece was release plumbing. Publishing used to fail whenever a push to `main` reused a version number that was already on PyPI. CI now looks up the latest published version and bumps the patch number automatically, unless I've already bumped it by hand past that. The version lives in exactly one place, `__version__`, and `setup.py` reads it from there. Pushes to `main` go straight to stable PyPI, and other branches build but never publish.
# 6. What's next
The package is intentionally boring: load the data correctly, load it fast, and get out of the way. The interesting work happens on top of it in the [abus-classification](https://github.com/mralinp/abus-classification) series. The next posts there cover the classical radiology features we reproduce as a baseline, and then the deep-learning models, all of them reading their data through `TDSCTumors`.
If you're working on TDSC-ABUS, `pip install tdsc-abus2023-pytorch` and please cite the challenge paper [1]. Issues and PRs are welcome on [GitHub](https://github.com/mralinp/tdsc-abus2023-pytorch).
# References
1. G. Luo et al. Tumor Detection, Segmentation and Classification Challenge on Automated 3D Breast Ultrasound: The TDSC-ABUS Challenge. arXiv:2501.15588, 2025. [arxiv.org/abs/2501.15588](https://arxiv.org/abs/2501.15588)
---
# ABUS Classification, Part 1: Mammography, Ultrasound, and Why 3D
- URL: https://alinaderiparizi.com/project/abus-classification/medical-imaging/ultrasound/mammography/breast-cancer/2026/09/16/abus-classification-1-imaging-modalities.html
- Date: 2026-09-16
- Kind: Project
- Topics: abus-classification, medical-imaging, ultrasound, mammography, breast-cancer
- Code: https://github.com/mralinp/abus-classification
- Summary: Before any classifier: what a breast tumor is, how mammography and ultrasound actually see it, and why this project works with 3D automated breast ultrasound instead of either alone.
This is the first post of a series following [abus-classification](https://alinaderiparizi.com/abus-classification/), a project classifying malignant and benign breast lesions in 3D automated breast ultrasound (ABUS). I'll add one post per phase of the project — this one is background, with no results yet: what a breast tumor is, how it gets imaged, and why this project uses 3D ultrasound specifically. [Part 2]({% post_url project/2026-11-03-abus-classification-2-reproducing-results %}) covers the classical baselines and hybrid-model reproduction results. [Part 3]({% post_url project/2026-11-03-abus-classification-3-laplace-beltrami %}) introduces Laplace–Beltrami geometry and investigates what the spectral features actually capture.
# 1. What we're actually looking for
A breast tumor is a mass of tissue that grows where it shouldn't. Most breast masses are benign — fibroadenomas, cysts, areas of fibrocystic change — and are not life-threatening. The ones that matter are malignant: cancer cells that, left alone, can invade surrounding tissue and spread elsewhere in the body. The entire point of breast imaging is to find a mass and estimate, without cutting the patient open, whether it's one or the other.
Imaging alone cannot give a definitive answer. A mammogram or an ultrasound scan produces an image that a radiologist scores on the BI-RADS scale, from "definitely benign" to "highly suggestive of malignancy" — a risk estimate, not a diagnosis. The only way to know for certain is a biopsy: a small sample of tissue examined under a microscope by a pathologist. What imaging is for is deciding *who needs a biopsy in the first place*, and increasingly, helping the radiologist read the image faster and more consistently. That second role — computer-aided reading — is what this project is ultimately building toward.
# 2. Two very different ways to make an image
Mammography and ultrasound solve the same problem — see inside the breast without surgery — using completely different physics, and that's why they see different things.
**Mammography** sends X-rays through the compressed breast and records how much of each ray gets absorbed on the way through. Denser tissue (glandular and fibrous tissue, and tumors, which tend to be denser than surrounding fat) absorbs more X-rays and shows up brighter; fat absorbs little and shows up dark. It's a projection, like a shadow: the whole breast thickness is compressed into one flat 2D image (two, usually — craniocaudal and mediolateral-oblique views, to get some sense of depth by triangulation). Mammography is very good at one thing in particular: **microcalcifications**, tiny calcium deposits as small as a fraction of a millimetre, which show up as bright specks and are an early sign of some cancers, well before a mass is large enough to feel.
**Ultrasound** sends high-frequency sound waves (typically 5–18 MHz for breast imaging) into the tissue from a transducer and listens for the echoes. Sound reflects wherever it crosses a boundary between tissues with different acoustic impedance — the fat/gland boundary, the edge of a mass, a duct wall. The transducer measures how long each echo takes to come back (time-of-flight gives depth, since the speed of sound in soft tissue is roughly constant at ~1540 m/s) and how strong it is (brightness), and building up one scan line per transducer element gives the familiar grayscale B-mode image. Unlike mammography, ultrasound produces no ionizing radiation, so it's used freely and repeatedly, including during pregnancy. It is comparatively poor at picking up microcalcifications, but very good at something mammography fundamentally cannot do at all: **telling a fluid-filled cyst from a solid mass**. A cyst transmits sound with almost no attenuation (posterior acoustic enhancement — everything behind it looks brighter), while a solid mass attenuates and scatters sound in ways that depend on its internal structure. That one distinction resolves a huge fraction of what would otherwise be ambiguous findings on a mammogram.
# 3. Why breast density makes this more than an academic distinction
Whether mammography or ultrasound "wins" for a given patient largely comes down to breast density — the ratio of glandular/fibrous tissue to fat, which the American College of Radiology grades A (almost entirely fatty) through D (extremely dense). Dense tissue and tumors are both radiographically dense, so a tumor sitting in dense tissue can be almost invisible on a mammogram — masked by the surrounding tissue rather than standing out against fat.
This isn't a small effect. A widely cited screening study of nearly 28,000 examinations found mammography's sensitivity dropped as low as the 30–48% range in women with extremely dense breasts, compared to consistently high sensitivity in fatty breasts [1]. A 2020 systematic review and meta-analysis across 21 studies found pooled sensitivity of 74% for mammography alone in dense breasts, rising to 96% when ultrasound was added — at some cost to specificity, since ultrasound also flags more benign findings that then need to be worked up [2]. That trade-off is exactly why ultrasound today is used as a *supplement* to mammography in dense breasts, not a replacement: mammography for microcalcifications and overall coverage, ultrasound for masses that mammography's own physics makes hard to see.
# 4. From handheld ultrasound to 3D ABUS
Ordinary breast ultrasound is done with a handheld transducer swept over the breast by a sonographer in real time. It works, but it has two structural problems that have nothing to do with the physics above. First, it's **operator-dependent** — the diagnostic quality of the exam depends on the skill and attention of whoever is holding the probe that day, at that moment, which makes it hard to standardize across sites or even across visits with the same patient. Second, a live 2D sweep is a poor thing to *review* later: the sonographer sees the full breast during the scan, but what gets saved are a handful of static frames, not the whole volume. A second radiologist reading those frames afterward is working with far less information than the person who did the scan.
Automated 3D breast ultrasound (ABUS) — the imaging technique this project's dataset uses — fixes both problems by automating the acquisition. A wide transducer mechanically sweeps across the whole breast in one motion, and the machine assembles the individual 2D slices into a single 3D volume, typically covering the breast in a few overlapping passes per side. Because the sweep itself is mechanical rather than hand-guided, every scan of every patient is acquired the same way, and — critically — **the entire volume is saved**, not just a few chosen frames. A radiologist reviewing an ABUS study afterward can scroll through it slice by slice in any of three standard planes (transversal, coronal, sagittal) at their own pace, the same way they'd review a CT or MRI, rather than depending on what a sonographer happened to capture live. Reviews of the technique report excellent agreement between different readers of the same ABUS volume, which is exactly the reproducibility handheld ultrasound struggles with [3].
The image below is one transversal slice through an ABUS volume from the TDSC-ABUS dataset this project uses — the same kind of slice a radiologist would scroll through, at a physical millimetre scale rather than raw pixels (ABUS voxels are not cubes, which turns out to matter a lot once you start measuring shape — more on that in a later post).
Five malignant and five benign lesions from the TDSC-ABUS dataset, each shown in the transversal plane through its centre at a common millimetre scale.
The coronal plane — the one roughly parallel to the chest wall, which a handheld scan essentially never captures — turns out to be particularly informative for malignancy, since it's the plane in which spiculation (cancer's characteristic radiating, starburst pattern) is most visible. That's a recurring theme in the next post: several of the strongest classical features for this problem only exist because ABUS gives you a plane handheld ultrasound doesn't.
The other side of automating the acquisition is that reading a full 3D volume, slice by slice, takes a radiologist considerably longer than glancing at a couple of 2D frames — which is the actual motivation for this whole project. If the volume is standardized and complete, it becomes something a model can be trained on, not just something a person has to scroll through. That's where the rest of this series goes: turning what a radiologist looks for in a volume like the one above — shape, margins, spiculation, texture — into features and models that can flag and classify a lesion automatically.
# References
1. T. M. Kolb, J. Lichy, J. H. Newhouse. Comparison of the performance of screening mammography, physical examination, and breast US and evaluation of factors that influence them: an analysis of 27,825 patient evaluations. *Radiology* 225(1):165–175, 2002. [doi:10.1148/radiol.2251011667](https://doi.org/10.1148/radiol.2251011667)
2. W.-H. Yuan, H.-C. Hsu, Y.-Y. Chen, C.-H. Wu. Supplemental breast cancer-screening ultrasonography in women with dense breasts: a systematic review and meta-analysis. *British Journal of Cancer* 123:673–688, 2020. [doi:10.1038/s41416-020-0928-1](https://doi.org/10.1038/s41416-020-0928-1)
3. J. C. M. van Zelst, R. M. Mann. Automated three-dimensional breast US for screening: technique, artifacts, and lesion characterization. *RadioGraphics* 38(3):663–683, 2018. [doi:10.1148/rg.2018170162](https://doi.org/10.1148/rg.2018170162)
4. R. F. Brem, L. Tabár, S. W. Duffy, et al. Assessing improvement in detection of breast cancer with three-dimensional automated breast US in women with dense breast tissue: the SomoInsight study. *Radiology* 274(3):663–673, 2015. [doi:10.1148/radiol.14132832](https://doi.org/10.1148/radiol.14132832)
---
# Smart Card: Building Your First Applet with jCardSim
- URL: https://alinaderiparizi.com/blog/embeded/smart-card/2026/09/04/smart-card-dev.html
- Date: 2026-09-04
- Kind: Blog post
- Topics: embeded, smart-card
- Summary: In the previous post we introduced smart cards and Java Card applets. Now it's time to get our hands dirty: setting up a Java Card project, simulating a real card with jCardSim, and writing our first applet, one that generates a key pair on the card and signs a challenge with it, the same core trick behind a FIDO/U2F security key.
# 0. Recap and the goal
In the [previous post]({{ "/blog/embeded/smart-card/2023/07/19/smart-card-intro.html" | relative_url }}) we talked about what smart cards are, how they work, and what an applet is in the Java Card world: a small, isolated program that runs inside the card's secure microprocessor and talks to the outside world through APDU commands.
That post ended with a promise: it's time to actually write one.
But I also want to be upfront about *why* I'm going down this path. The real target of this series is not "print hello world on a card." It's building a hardware security token, a smart card that can act as a **FIDO/U2F security key**. FIDO keys (like a YubiKey) are, under the hood, exactly this kind of device: a secure element running an applet that generates and stores key pairs, signs authentication challenges, and never lets the private key leave the chip. Java Card gives us the same building blocks: isolated applet execution, on-card cryptography, and a well-defined command/response protocol over APDUs.
Before we touch real hardware, cryptography, or the FIDO protocol though, we need to get comfortable with the basics: writing an applet, installing it, and exchanging APDUs with it. And we're going to do all of that **without a physical smart card or reader**, using a simulator called jCardSim.
# 1. Why simulate the card first
Real Java Card smart cards are cheap, but the development loop around them is not fun:
- You need a physical card, a compatible reader, and often a card that accepts your own applets (many bank/SIM cards are locked down).
- Every test cycle means: compile, convert to a `.cap` file, load it onto the card over a reader, run it, and if something's wrong, erase and repeat.
- Debugging is close to impossible. There's no breakpoint, no stack trace, just a status word telling you something went wrong.
That's a painful way to learn a new, restricted dialect of Java. This is exactly the gap **jCardSim** fills.
# 2. What is jCardSim
[jCardSim](https://github.com/licel/jcardsim) is an open source, pure-Java simulator for the Java Card runtime environment (JCRE). It implements enough of the Java Card API (`javacard.framework`, `javacard.security`, and friends) to load and run real applet code, the same `.class` files you'd eventually convert into a `.cap` file for a physical card, entirely inside a JVM on your laptop.
A few things that make it genuinely useful, not just a toy:
- **No hardware required.** You write an applet, install it into a simulated card object, and start sending it APDUs immediately.
- **It speaks the same language as `javax.smartcardio`.** jCardSim exposes a `CardSimulator` that you drive with the standard Java smart card I/O API (`CommandAPDU` / `ResponseAPDU`), the exact same classes you'd use to talk to a real card through a PC/SC reader. That means code you write against the simulator is structurally the same code you'd use against real hardware later.
- **It's fast enough for real unit testing.** We used it on real projects to write automated tests for applet logic (state machines, PIN verification, data encoding) in a normal CI pipeline, no reader, no lab, no flaky USB drivers.
- **It's a stepping stone, not a replacement.** The simulator doesn't emulate every timing quirk or memory constraint of a real chip, so the last mile of testing on actual hardware still matters. But it removes 90% of the friction from the early development loop.
For prototyping something like a FIDO applet, where you'll be iterating a lot on command parsing, state handling, and cryptographic flows, this is exactly the tool you want before you ever plug in a real card.
# 3. Setting up the project
A minimal Java Card + jCardSim project needs two sets of dependencies:
1. The **Java Card Classic API** (`javacard.framework`, etc.), just to compile against the applet interfaces. jCardSim ships an implementation of these on the classpath, so for a simulation-only project you don't need Oracle/Global Platform's official Java Card Development Kit at all.
2. **jCardSim** itself, to get `CardSimulator`, `AIDUtil`, and the simulated runtime classes.
With Maven, a `pom.xml` for a small sandbox project looks roughly like this:
```xml
com.liceljcardsim3.0.5-SNAPSHOT
```
The exact coordinates and available versions have moved around over the years (the project isn't always on Maven Central), so if that dependency doesn't resolve, grab the jar directly from the [jCardSim GitHub releases](https://github.com/licel/jcardsim) or build it from source with the repo's own instructions, and install it into your local `.m2` repository. Either way, once the jar is on your classpath you're ready to write the applet itself.
# 4. Our first applet: generate a key pair and sign a challenge
A "Hello World" applet wouldn't really tell us anything about the road ahead, so let's skip straight to the thing a security key actually does: **generate a key pair on the card, keep the private key locked inside it forever, and sign whatever challenge it's asked to sign.** That's the entire trust model behind FIDO/U2F, register a public key once, then prove possession of the matching private key on every login, and it's a handful of calls into `javacard.security`.
Every Java Card applet has the same shape: an `install()` factory method the JCRE calls when the applet is loaded, and a `process()` method the JCRE calls for every APDU sent to it. Ours generates its key pair once, at install time, and exposes two instructions: one to read back the public key, one to sign a challenge with the private key.
```java
package com.mralinp.simplesign;
import javacard.framework.APDU;
import javacard.framework.Applet;
import javacard.framework.ISO7816;
import javacard.framework.ISOException;
import javacard.security.KeyBuilder;
import javacard.security.KeyPair;
import javacard.security.RSAPublicKey;
import javacard.security.Signature;
public class SimpleSignApplet extends Applet {
private static final byte INS_SIGN = (byte) 0x01;
private static final byte INS_GET_PUBLIC_KEY = (byte) 0x02;
private final KeyPair keyPair;
private final Signature signer;
protected SimpleSignApplet() {
// Generate a fresh 1024-bit RSA key pair the moment the applet is installed.
// The private key never leaves this object, and never leaves the card.
keyPair = new KeyPair(KeyPair.ALG_RSA_CRT, KeyBuilder.LENGTH_RSA_1024);
keyPair.genKeyPair();
signer = Signature.getInstance(Signature.ALG_RSA_SHA_PKCS1, false);
register();
}
public static void install(byte[] bArray, short bOffset, byte bLength) {
new SimpleSignApplet();
}
@Override
public void process(APDU apdu) {
if (selectingApplet()) {
return;
}
byte[] buffer = apdu.getBuffer();
byte instruction = buffer[ISO7816.OFFSET_INS];
switch (instruction) {
case INS_GET_PUBLIC_KEY:
sendPublicKey(apdu);
break;
case INS_SIGN:
signChallenge(apdu);
break;
default:
ISOException.throwIt(ISO7816.SW_INS_NOT_SUPPORTED);
}
}
private void sendPublicKey(APDU apdu) {
byte[] buffer = apdu.getBuffer();
RSAPublicKey publicKey = (RSAPublicKey) keyPair.getPublic();
// buffer[0] holds the exponent length, so the caller knows where the modulus starts.
short exponentLength = publicKey.getExponent(buffer, (short) 1);
buffer[0] = (byte) exponentLength;
short modulusLength = publicKey.getModulus(buffer, (short) (1 + exponentLength));
apdu.setOutgoingAndSend((short) 0, (short) (1 + exponentLength + modulusLength));
}
private void signChallenge(APDU apdu) {
byte[] buffer = apdu.getBuffer();
apdu.setIncomingAndReceive();
short challengeLength = apdu.getIncomingLength();
signer.init(keyPair.getPrivate(), Signature.MODE_SIGN);
short signatureLength = signer.sign(buffer, ISO7816.OFFSET_CDATA, challengeLength, buffer, (short) 0);
apdu.setOutgoingAndSend((short) 0, signatureLength);
}
}
```
A couple of things worth calling out for anyone new to this API, since it looks like Java but behaves like embedded C in places:
- `install()` is a **static factory**, not a constructor you call yourself. The JCRE invokes it when the applet is loaded onto the card, and it's responsible for constructing the applet instance and calling `register()` so the card knows this applet exists and can be selected. Key generation happens right there, once, up front, exactly the way a real token generates its device key the moment it's provisioned.
- `process()` is called for **every single APDU**, including the `SELECT` command used to activate the applet before anything else can happen. That's why the very first thing we do is check `selectingApplet()` and return early, we don't want to fall into our instruction switch for a `SELECT`.
- Everything happens through a **shared APDU buffer** (`apdu.getBuffer()`). There's no heap of objects being passed around, incoming challenge bytes are read straight out of the buffer and the signature is written straight back into it. This is a direct consequence of how little RAM a real smart card chip has.
- The `RSAPrivateCrtKey` half of `keyPair` is never read, copied, or sent anywhere in this code. It only ever gets handed to `signer.init(...)`, which uses it internally to produce a signature. That's the whole point: the card proves it holds the key without ever exposing it.
We're using RSA here rather than the ECDSA over P-256 that real FIDO devices use, mainly because RSA key generation needs nothing beyond a modulus length, while EC key generation on Java Card normally requires setting explicit curve domain parameters first. It keeps this first example short. When we build the real FIDO applet, we'll switch `KeyPair.ALG_RSA_CRT` for `KeyPair.ALG_EC_FP` and set up the P-256 domain parameters properly.
# 5. Running it in jCardSim
Now the payoff: let's install this applet into a simulated card, ask it for its public key, hand it a challenge to sign, and verify the signature ourselves, all without a physical card or reader.
```java
package com.mralinp.simplesign;
import com.licel.jcardsim.smartcardio.CardSimulator;
import com.licel.jcardsim.utils.AIDUtil;
import javacard.framework.AID;
import javax.smartcardio.CommandAPDU;
import javax.smartcardio.ResponseAPDU;
import java.math.BigInteger;
import java.security.KeyFactory;
import java.security.PublicKey;
import java.security.Signature;
import java.security.spec.RSAPublicKeySpec;
import java.util.Arrays;
public class SimpleSignTest {
public static void main(String[] args) throws Exception {
// 1. Create a simulated card and install our applet on it
CardSimulator simulator = new CardSimulator();
AID appletAID = AIDUtil.create("A000000003000002");
simulator.installApplet(appletAID, SimpleSignApplet.class);
simulator.selectApplet(appletAID);
// 2. Ask the card for the public half of the key it generated at install time
ResponseAPDU pubKeyResponse = simulator.transmitCommand(new CommandAPDU(0x00, 0x02, 0x00, 0x00));
byte[] pubKeyBytes = pubKeyResponse.getData();
int exponentLength = pubKeyBytes[0] & 0xFF;
BigInteger exponent = new BigInteger(1, Arrays.copyOfRange(pubKeyBytes, 1, 1 + exponentLength));
BigInteger modulus = new BigInteger(1, Arrays.copyOfRange(pubKeyBytes, 1 + exponentLength, pubKeyBytes.length));
PublicKey publicKey = KeyFactory.getInstance("RSA")
.generatePublic(new RSAPublicKeySpec(modulus, exponent));
// 3. Send a "login challenge" and have the card sign it with its private key
byte[] challenge = "login-challenge-42".getBytes();
ResponseAPDU signResponse = simulator.transmitCommand(new CommandAPDU(0x00, 0x01, 0x00, 0x00, challenge));
byte[] signature = signResponse.getData();
// 4. Verify the signature ourselves, exactly like a server would on the other end
Signature verifier = Signature.getInstance("SHA1withRSA");
verifier.initVerify(publicKey);
verifier.update(challenge);
System.out.println("Signature valid: " + verifier.verify(signature));
}
}
```
Running it prints:
```text
Signature valid: true
```
Nothing about steps 3 and 4 talked to the card, the private key stayed inside the simulated chip the entire time. We only ever handed the card a challenge and got a signature back, then verified that signature ourselves using nothing but the public key it gave us in step 2. That round trip, hand the token a challenge, get back a signature you can verify against a previously-registered public key, is the actual core of how a FIDO/U2F authentication works.
# 6. Where this is going
This applet is already doing the two things a real security key needs to do: keep a private key that never leaves the chip, and prove possession of it by signing on demand. What's missing is the FIDO/U2F protocol wrapped around that behavior, a `REGISTER` command that returns a properly formatted attestation, an `AUTHENTICATE` command that tracks and increments a usage counter, ECDSA over the P-256 curve instead of RSA, and key handles instead of a single fixed key pair.
In the next post, we'll build on this same jCardSim setup and start implementing the actual FIDO U2F command set on top of it, one instruction at a time, before ever touching a real card. Stay tuned.
# References
1. Licel. jCardSim — Java Card simulator. GitHub. [github.com/licel/jcardsim](https://github.com/licel/jcardsim)
2. Oracle. Java Card Classic Platform API Specification (`javacard.framework`, `javacard.security`). [docs.oracle.com/javacard](https://docs.oracle.com/javacard/)
3. ISO/IEC 7816-4. Identification cards — Integrated circuit cards — Part 4: Organization, security and commands for interchange (APDU structure).
4. FIDO Alliance. Universal 2nd Factor (U2F) Overview. [fidoalliance.org/specs/u2f-specs-master/fido-u2f-overview.html](https://fidoalliance.org/specs/u2f-specs-master/fido-u2f-overview.html)
---
# Smart Card: An Introduction to smart card development
- URL: https://alinaderiparizi.com/blog/embeded/smart-card/2023/07/19/smart-card-intro.html
- Date: 2023-07-19
- Kind: Blog post
- Topics: embeded, smart-card
- Summary: Smart cards are small, pocket-sized cards that contain an embedded microprocessor and memory chip. These cards are often made of plastic, and they look similar to traditional credit or debit cards, but they possess advanced technology that sets them apart. Smart cards are designed to securely store and process data, making them a powerful tool for various applications in today's digital world.
# 0. Introduction
Smart cards are small, pocket-sized cards that contain an embedded microprocessor and memory chip. These cards are often made of plastic, and they look similar to traditional credit or debit cards, but they possess advanced technology that sets them apart. Smart cards are designed to securely store and process data, making them a powerful tool for various applications in today's digital world.
There are two main types of smart cards:
- **Contact Smart Cards**: These cards have gold-plated contact pads on their surface, which need to physically touch a card reader to establish communication. When inserted into a card reader or terminal, the contacts establish an electrical connection, enabling data transfer between the card and the reader. The data exchange can involve tasks such as authentication, data storage, and cryptographic operations.
- **Contactless Smart Cards**: In contrast to contact smart cards, contactless smart cards do not require physical contact with a card reader. Instead, they use radio frequency identification (RFID) technology to communicate wirelessly with compatible card readers or terminals. This communication occurs when the card is placed within close proximity to the reader, making contactless smart cards particularly convenient and efficient for quick transactions.
Smart cards find applications in a wide range of industries and use cases, including:
- **Financial Transactions**: They are commonly used for secure payments in credit/debit cards, prepaid cards, and electronic wallets.
- **Access Control and Security**: Smart cards are used for secure building access, network authentication, and data protection.
- **Healthcare**: They facilitate secure access to electronic health records, patient identification, and prescription management.
- **Transportation**: Smart cards are utilized in fare collection systems for public transport, allowing for seamless ticketing and fare management.
- **Government Identification**: National ID cards, driver's licenses, and electronic passports often incorporate smart card technology for enhanced security features.
The ability of smart cards to securely store sensitive data, perform cryptographic operations, and communicate with various systems has made them an indispensable component of modern technology, ensuring safer and more efficient transactions and interactions in numerous domains.
Smart cards are equipped with a microprocessor and a specialized operating system, which sets them apart from traditional magnetic stripe cards. The presence of these components enables smart cards to perform more sophisticated functions and offer enhanced security features.
1. **Microprocessor**:
The microprocessor is the brain of the smart card, responsible for executing commands and processing data. It is a small integrated circuit that can perform complex calculations and cryptographic operations. The microprocessor allows the card to interact intelligently with card readers or terminals, enabling secure data exchange and executing specific tasks according to the applications it supports.
2. **Operating System**:
The operating system (OS) of a smart card is a specialized software that manages the card's functions, controls access to its resources, and provides a standardized interface for applications to interact with the card's hardware and data. The operating system facilitates communication with the outside world, ensuring that commands and data sent to the card are processed correctly and securely.
The presence of a microprocessor and an operating system on smart cards allows for several important capabilities:
1. **Security Features**:
Smart cards use their microprocessors to perform encryption and decryption operations, making them highly secure for sensitive transactions and data storage. The operating system plays a crucial role in managing cryptographic keys and ensuring secure access to the card's data.
2. **Secure Application Execution**:
The operating system provides a secure environment for applications running on the smart card. It isolates different applications from one another, preventing unauthorized access and ensuring that one application's activities cannot compromise the security of others on the same card.
3. **Multiple Applications**:
Smart cards have the ability to support multiple applications simultaneously. For example, a single smart card can be used for electronic payments, access control, and healthcare records. The operating system facilitates seamless execution and switching between these applications.
4. **Dynamic Updates**:
The operating system can be updated or patched to address security vulnerabilities or add new features to the smart card without replacing the physical card itself.
Due to these advanced features, smart cards have become a reliable and secure tool for various applications, such as financial transactions, secure access control, healthcare, and more. The combination of a microprocessor and an operating system empowers smart cards to deliver enhanced functionality, robust security, and unparalleled convenience in the digital age.
In the context of smart cards, an applet refers to a small, specialized software application that runs on the smart card's microprocessor and is managed by the card's operating system. These applets are designed to perform specific functions or provide particular services on the smart card. They enable the smart card to support various applications and perform tasks relevant to the cardholder's needs.
# 1. Applets
Applets on smart cards are comparable to apps on a smartphone. Each applet functions as a self-contained program with a defined set of functionalities, and multiple applets can coexist on the same smart card without interfering with each other. This modularity and isolation of applets are essential for maintaining security and ensuring that sensitive data from one application remains isolated from others.
The key characteristics of applets on smart cards include:
1. **Security**:
Applets are designed with security in mind, ensuring that the data and operations they perform remain protected from unauthorized access. The smart card's operating system enforces strict access controls to prevent unauthorized applets from interfering with sensitive data or executing malicious operations.
2. **Isolation**:
Each applet runs within its own secure execution environment, isolated from other applets on the smart card. This isolation prevents one applet from accessing data or resources belonging to another, ensuring a high level of data privacy and integrity.
3. **Flexibility**:
Applets can be added, removed, or updated on the smart card without replacing the physical card itself. This flexibility allows card issuers to introduce new services or applications to the card without disrupting existing functionalities.
4. **Common Criteria Compliance**:
Applets are typically developed following the Common Criteria standard, which defines security requirements for evaluating and certifying the security of IT products, including smart cards.
Examples of applets on smart cards include:
- **Payment Applet**: Enables secure financial transactions and management of funds on the smart card, allowing it to be used as a debit or credit card.
- **Identity Applet**: Stores and manages personal identification information for government-issued identification cards or electronic passports.
- **Health Applet**: Manages electronic health records and provides secure access to patient information for healthcare applications.
- **Access Control Applet**: Facilitates secure access to buildings, computer systems, or networks by providing authentication and authorization services.
Overall, applets on smart cards play a crucial role in extending the card's capabilities, enhancing security, and enabling multiple applications to coexist on a single card while maintaining data privacy and integrity.
# 2. Developing Applets
Writing applets for smart cards requires specialized skills and knowledge of smart card technology, microcontroller programming, and the specific programming language supported by the smart card's microprocessor. Most smart cards use the Java Card platform, which allows developers to write applets in Java Card language.
Here are the general steps to write applets for smart cards:
1. **Set Up Development Environment**:
First, you need to set up the development environment for smart card applet development. This involves installing the necessary software development kit (SDK) provided by the smart card manufacturer or Java Card platform.
2. **Learn Java Card Programming**:
Familiarize yourself with Java Card programming, which is a subset of the Java programming language tailored for smart card development. Understand the limitations and specific features of Java Card, as it differs from regular Java programming.
3. **Define Applet Functionality**:
Determine the functionality you want your applet to provide. Identify the specific tasks the applet should perform on the smart card, such as handling financial transactions, managing access control, or storing and retrieving sensitive data.
4. **Develop the Applet Code**:
Write the applet code in Java Card language. This code will define the behavior and operations of the applet on the smart card. Ensure that the applet code adheres to the security requirements and best practices for smart card development.
5. **Compile and Convert to CAP File**:
After writing the applet code, compile it using the Java Card compiler to produce a .cap file (CAP stands for "Converted Applet"). This file contains the binary representation of the applet code, ready for installation on the smart card.
6. **Load the Applet onto the Smart Card**:
Use the appropriate tools or APIs provided by the smart card manufacturer or Java Card platform to load the .cap file onto the smart card. This process is known as "applet installation."
7. **Test and Debug**:
Test the applet on the smart card to ensure that it functions as expected. Debug any issues that may arise during testing, making necessary adjustments to the applet code if needed.
8. **Deploy and Distribute**:
Once the applet is thoroughly tested and verified, it can be deployed on the desired smart cards or distributed to end-users through card issuers or service providers.
Please note that writing applets for smart cards requires expertise in smart card development and may vary depending on the specific smart card's capabilities and the programming language supported by its microprocessor. It's essential to refer to the smart card manufacturer's documentation and Java Card specifications for detailed guidelines and best practices when developing applets for smart cards.
Next time, I'll prepare an article about developing an applet and playing around with this old technology. Stay tuned...
# References
1. ISO/IEC 7816 (all parts). Identification cards — Integrated circuit cards. International Organization for Standardization.
2. GlobalPlatform. Card Specification. [globalplatform.org/specs-library](https://globalplatform.org/specs-library/)
3. Oracle. Java Card Technology. [oracle.com/java/technologies/java-card-tech.html](https://www.oracle.com/java/technologies/java-card-tech.html)
---
# PyTorch Tutorial, Part 2: Datasets and DataLoaders
- URL: https://alinaderiparizi.com/blog/ai/machine-learning/deep-learning/python/pytorch/2023/03/27/pytorch-tutorial-2.html
- Date: 2023-03-27
- Kind: Blog post
- Topics: ai, machine-learning, deep-learning, python, pytorch
- Summary: PyTorch's Dataset and DataLoader classes, built up from a custom dataset to a full training loop, classifying real wine samples with a small neural network.
[Part 1](https://alinaderiparizi.com/blog/ai/machine-learning/deep-learning/python/pytorch/2023/03/22/pytorch-tutorial-1.html) trained on data that lived entirely in a few lines of Python — five numbers, or a scikit-learn dataset that loads fully into memory in one call. Real datasets are rarely that convenient: they're too large to hold in memory at once, they need shuffling and batching so the model doesn't just memorize the order they're stored in, and loading and preprocessing them shouldn't block the GPU from training while it waits. PyTorch's `Dataset` and `DataLoader` classes exist specifically to solve that, by cleanly separating two concerns that are easy to tangle together: *what* your data is and how to fetch one example of it (`Dataset`), and *how* to turn a stream of individual examples into shuffled, batched tensors ready for a training loop (`DataLoader`). This post builds both up from scratch, then — unlike a lot of tutorials that stop at "here's how to load data" — actually trains a real classifier with what we build, tying it back to Part 1's training loop.
# 1. A custom Dataset
We'll use the classic [Wine dataset](https://archive.ics.uci.edu/dataset/109/wine) from the UCI Machine Learning Repository [1]: 178 wine samples, each with 13 chemical measurements (alcohol content, malic acid, ash, and so on) and a label — which of three cultivars the wine came from. It's a genuinely nice dataset to learn on: small enough to inspect by eye, real enough to have actual measurement noise, and a multi-class (not just binary) classification problem, which we didn't cover in Part 1. Download `wine.data` from the repository page and place it somewhere like `../data/wine/wine.data` relative to your script (I keep a `data/` directory alongside my code for exactly this).
Every PyTorch `Dataset` is a class inheriting from `torch.utils.data.Dataset` that implements exactly two methods: `__getitem__(self, index)`, returning the sample at that index, and `__len__(self)`, returning the total number of samples. That's the entire contract — PyTorch doesn't care *how* you fetch a sample (from a NumPy array already in memory, from a file you open lazily on each call, from a network request), only that these two methods work.
```python
import torch
import numpy as np
PATH_TO_DATASET = '../data/wine/wine.data'
class WineDataset(torch.utils.data.Dataset):
def __init__(self) -> None:
# The file is one row per sample, comma-separated, label in column 0
# and the 13 features in the remaining columns.
raw_data = np.loadtxt(PATH_TO_DATASET, delimiter=',', dtype=np.float32)
self.x = torch.from_numpy(raw_data[:, 1:])
self.y = torch.from_numpy(raw_data[:, [0]])
self.n_samples = self.x.shape[0]
self.n_features = self.x.shape[1]
def __getitem__(self, index):
return self.x[index], self.y[index]
def __len__(self):
return self.n_samples
```
Now we can use it like any indexable, sized Python object:
```python
dataset = WineDataset()
print(f"{len(dataset)} samples, {dataset.n_features} features each")
x_sample, y_sample = dataset[0]
print(f"x: {x_sample}, y: {y_sample}")
```
```txt
178 samples, 13 features each
x: tensor([1.4230e+01, 1.7100e+00, 2.4300e+00, 1.5600e+01, 1.2700e+02, 2.8000e+00,
3.0600e+00, 2.8000e-01, 2.2900e+00, 5.6400e+00, 1.0400e+00, 3.9200e+00,
1.0650e+03]), y: tensor([1.])
```
**If you'd rather skip the manual download** while learning, scikit-learn ships this exact dataset built in — `sklearn.datasets.load_wine()` returns the same 178-sample, 13-feature data without touching the filesystem. Either source is fine for this post; we'll stick with the custom-file version above because loading your *own* CSV or data file, not a bundled toy dataset, is the far more common real-world need this section is actually teaching.
That's it — it looks almost too simple, and that's the point. The class does nothing exotic; it just gives PyTorch a uniform interface so everything downstream (batching, shuffling, parallel loading) can be written once, generically, for *any* dataset that implements these two methods.
# 2. DataLoader
A `Dataset` alone only gets you one sample at a time. `torch.utils.data.DataLoader` wraps a `Dataset` and handles everything you actually want during training: grouping samples into batches, shuffling their order every epoch, and optionally loading them in parallel.
```python
dataloader = torch.utils.data.DataLoader(dataset=dataset, batch_size=16, shuffle=True, num_workers=2)
```
Each argument is doing a specific, named job worth understanding rather than copy-pasting:
- **`batch_size`** — how many samples to group into one tensor per training step. Training on one sample at a time is slow (poor use of GPU parallelism) and noisy (each update is based on very little information); training on the *entire* dataset at once (`batch_size = len(dataset)`) is the other extreme — one very stable but very infrequent and memory-hungry update per epoch. Something in between — commonly 16, 32, 64, ... — is the usual sweet spot, and it's a hyperparameter worth experimenting with rather than treating as fixed.
- **`shuffle=True`** — reshuffles the dataset's order at the start of every epoch. Without this, a model can pick up on spurious patterns tied to *storage order* (e.g., if all of one class happens to be grouped at the end of the file) rather than the actual features — always shuffle your training data unless you have a specific reason not to (sequential data like time series is the usual exception).
- **`num_workers`** — how many separate OS processes load and preprocess batches in the background, in parallel with the GPU training on the *previous* batch, so the GPU spends less time idle waiting for data. `0` (the default) loads data in the main process, which is simplest and fine for small in-memory datasets like this one; it starts mattering once loading involves real work (decoding images, reading from disk). One Windows/macOS-specific gotcha: with `num_workers > 0`, your training script needs its DataLoader-using code inside an `if __name__ == '__main__':` guard, because those platforms re-import your script in each worker process, and without the guard you get infinite recursive process spawning.
You can iterate a `DataLoader` directly, and it hands you one batch at a time:
```python
for batch_x, batch_y in dataloader:
print(batch_x.shape, batch_y.shape) # torch.Size([16, 13]) torch.Size([16, 1])
break # just peek at the first batch
```
Or, if you want a single batch without a loop (useful for quick inspection in a notebook), wrap it in `iter()` and call `next()`:
```python
dataiter = iter(dataloader)
x, y = next(dataiter)
print(x, y)
```
```txt
tensor([[1.3740e+01, 1.6700e+00, 2.2500e+00, ..., 9.2000e-01, 3.2000e+00, 1.0600e+03],
[1.1660e+01, 1.8800e+00, 1.9200e+00, ..., 1.2300e+00, 2.1400e+00, 4.2800e+02],
...
[1.3500e+01, 1.8100e+00, 2.6100e+00, ..., ... ]])
tensor([[1.], [2.], [1.], ...])
```
In real training loops you'll almost always use the `for batch_x, batch_y in dataloader:` form directly (we'll do exactly that in Section 4) — `iter()`/`next()` is mainly useful for debugging or peeking at a batch's shape and content interactively.
## 2.1 Splitting into train and test sets
`WineDataset` above loads the whole file as one dataset, but we need separate train and test splits, the same way `train_test_split` did in Part 1. `torch.utils.data.random_split` does the same job directly on a `Dataset` object, without pulling everything into NumPy first:
```python
train_size = int(0.8 * len(dataset))
test_size = len(dataset) - train_size
train_dataset, test_dataset = torch.utils.data.random_split(dataset, [train_size, test_size])
train_loader = torch.utils.data.DataLoader(train_dataset, batch_size=16, shuffle=True)
test_loader = torch.utils.data.DataLoader(test_dataset, batch_size=16, shuffle=False)
```
Shuffling the test loader isn't necessary (we're not training on it, and order doesn't affect evaluation), so it's conventional to leave `shuffle=False` there — it's one less source of non-determinism when you're comparing runs.
# 3. Transforms
Sometimes you need to modify raw data before using it — normalizing values to a consistent scale (Part 1's `StandardScaler` did this for the breast cancer features), converting types, or, for images specifically, data augmentation: randomly cropping, flipping, or color-jittering each image slightly differently on every epoch, so the model sees a slightly different version of the "same" example each time and generalizes better instead of memorizing exact pixels. We can support this in our own `Dataset` by accepting an optional list of transform functions in the constructor, and applying them in order inside `__getitem__`:
```python
class WineDataset(torch.utils.data.Dataset):
def __init__(self, transforms=None) -> None:
raw_data = np.loadtxt(PATH_TO_DATASET, delimiter=',', dtype=np.float32)
self.x = raw_data[:, 1:]
self.y = raw_data[:, [0]]
self.n_samples = self.x.shape[0]
self.n_features = self.x.shape[1]
self.transforms = transforms or []
def __getitem__(self, index):
sample = (self.x[index], self.y[index])
for transform in self.transforms:
sample = transform(sample)
return sample
def __len__(self):
return self.n_samples
```
A transform can be any callable, but the idiomatic PyTorch pattern is a class implementing `__call__`, so a transform can carry its own configuration (like the scale factor below) as ordinary attributes:
```python
class ToTensorTransformer:
def __call__(self, sample):
x, y = sample
return torch.from_numpy(x), torch.from_numpy(y)
class MultiplierTransformer:
def __init__(self, factor: float):
self.factor = factor
def __call__(self, sample):
x, y = sample
x = x * self.factor
return x, y
```
Pass a list of transforms to the constructor, and they're applied in order, each one's output feeding the next:
```python
dataset = WineDataset(transforms=[ToTensorTransformer(), MultiplierTransformer(10)])
x_sample, y_sample = dataset[0]
print(f"x: {x_sample}, y: {y_sample}")
```
```txt
x: tensor([1.4230e+02, 1.7100e+01, 2.4300e+01, 1.5600e+02, 1.2700e+03, 2.8000e+01,
3.0600e+01, 2.8000e+00, 2.2900e+01, 5.6400e+01, 1.0400e+01, 3.9200e+01,
1.0650e+04]), y: tensor([1.])
```
This hand-rolled pattern is worth building once to understand it, but for real work — especially with images — reach for `torchvision.transforms.Compose` instead of writing your own list-and-loop logic: it's the same idea (a sequence of callables, applied in order) with a large library of ready-made, well-tested transforms (resizing, cropping, normalization, augmentation) already implemented [2].
# 4. Putting it together: training a real classifier
Everything so far has been plumbing. Let's use it: a small neural network, trained on `WineDataset` through a `DataLoader`, classifying wine samples into one of three cultivars — combining this post's data pipeline with Part 1's training loop.
Two wrinkles specific to multi-class classification, worth flagging before the code: the Wine dataset's labels are `1`, `2`, `3`, but PyTorch's multi-class loss function expects `0`-indexed integer class labels, so we subtract 1; and instead of Part 1's single output neuron plus sigmoid (built for *binary* classification — one probability), we now need **one output per class**, interpreted as that class's un-normalized score, and PyTorch's `CrossEntropyLoss` — which combines a softmax (turning raw scores into a probability distribution over classes) and negative-log-likelihood loss into one numerically stable operation — expects exactly that: raw scores in, integer class index out, no manual softmax needed.
```python
import torch
import numpy as np
class WineDataset(torch.utils.data.Dataset):
def __init__(self) -> None:
raw_data = np.loadtxt(PATH_TO_DATASET, delimiter=',', dtype=np.float32)
self.x = torch.from_numpy(raw_data[:, 1:])
# Labels are 1/2/3 in the file; CrossEntropyLoss wants 0-indexed classes.
self.y = torch.from_numpy(raw_data[:, 0] - 1).long()
self.n_samples = self.x.shape[0]
self.n_features = self.x.shape[1]
def __getitem__(self, index):
return self.x[index], self.y[index]
def __len__(self):
return self.n_samples
dataset = WineDataset()
train_size = int(0.8 * len(dataset))
test_size = len(dataset) - train_size
train_dataset, test_dataset = torch.utils.data.random_split(dataset, [train_size, test_size])
train_loader = torch.utils.data.DataLoader(train_dataset, batch_size=16, shuffle=True)
test_loader = torch.utils.data.DataLoader(test_dataset, batch_size=16, shuffle=False)
class WineClassifier(torch.nn.Module):
def __init__(self, n_features, n_classes):
super().__init__()
# One hidden layer with a ReLU activation: without a nonlinearity between
# layers, stacking two Linear layers would collapse into one big Linear
# layer mathematically, gaining nothing over Part 1's single neuron.
self.net = torch.nn.Sequential(
torch.nn.Linear(n_features, 16),
torch.nn.ReLU(),
torch.nn.Linear(16, n_classes),
)
def forward(self, x):
return self.net(x)
model = WineClassifier(dataset.n_features, n_classes=3)
criterion = torch.nn.CrossEntropyLoss()
optimizer = torch.optim.Adam(model.parameters(), lr=0.01)
num_epochs = 50
for epoch in range(num_epochs):
model.train()
for batch_x, batch_y in train_loader:
y_pred = model(batch_x)
loss = criterion(y_pred, batch_y)
loss.backward()
optimizer.step()
optimizer.zero_grad()
if epoch % 5 == 0:
model.eval()
correct, total = 0, 0
with torch.no_grad():
for batch_x, batch_y in test_loader:
predicted_class = model(batch_x).argmax(dim=1)
correct += (predicted_class == batch_y).sum().item()
total += batch_y.size(0)
print(f"epoch: {epoch}, loss: {loss.item():.3f}, test accuracy: {correct/total:.3f}")
```
```output
epoch: 0, loss: 0.812, test accuracy: 0.639
epoch: 5, loss: 0.213, test accuracy: 0.917
epoch: 10, loss: 0.084, test accuracy: 0.972
epoch: 15, loss: 0.031, test accuracy: 0.972
epoch: 20, loss: 0.014, test accuracy: 1.000
epoch: 25, loss: 0.028, test accuracy: 1.000
epoch: 30, loss: 0.006, test accuracy: 1.000
epoch: 35, loss: 0.040, test accuracy: 1.000
epoch: 40, loss: 0.045, test accuracy: 1.000
epoch: 45, loss: 0.003, test accuracy: 1.000
```
(Exact numbers will vary run to run — weight initialization and the train/test split from `random_split` are both randomized — but convergence to high accuracy within a few dozen epochs is expected on this dataset.)
Two small but easy-to-miss details in that loop: `model.train()` and `model.eval()` don't do any computation themselves — they just flip an internal flag that layers like dropout and batch normalization check to behave differently at train vs. test time (this network doesn't use either, so it's a no-op here, but it's the kind of habit worth building now rather than debugging silently-wrong eval-mode behavior later). And `.argmax(dim=1)` is how you go from `CrossEntropyLoss`'s raw per-class scores back to an actual predicted class: the index of the largest score, per sample.
This is the first genuinely complete pipeline in this series — data on disk, to a `Dataset`, to shuffled batches via a `DataLoader`, through a real (if small) multi-layer network, trained and evaluated with a proper train/test split. Every larger model you build afterward is this same shape, with a bigger network in the middle.
# 5. Conclusion
We built a custom `Dataset` around a real file on disk, wrapped it in a `DataLoader` for batching and shuffling, added support for transforms, and — tying it back to Part 1 — trained an actual small neural network end to end on that pipeline, with a proper train/test split and multi-class classification. That combination (`Dataset` + `DataLoader` + an `nn.Module` + a loss + an optimizer) is the complete skeleton of virtually every PyTorch project you'll build from here on; later posts in this series put bigger, more specialized pieces into that same skeleton rather than changing its shape.
# References
1. S. Aeberhard, M. Forina. Wine [Dataset]. UCI Machine Learning Repository, 1992. [doi.org/10.24432/C5PC7J](https://doi.org/10.24432/C5PC7J)
2. PyTorch. `torchvision.transforms` documentation. [pytorch.org/vision/stable/transforms.html](https://pytorch.org/vision/stable/transforms.html)
3. PyTorch. `torch.utils.data` documentation (Dataset, DataLoader, random_split). [pytorch.org/docs/stable/data.html](https://pytorch.org/docs/stable/data.html)
4. PyTorch. Datasets & DataLoaders tutorial. [pytorch.org/tutorials/beginner/basics/data_tutorial.html](https://pytorch.org/tutorials/beginner/basics/data_tutorial.html)
---
# PyTorch Tutorial, Part 1: Installation and The Basics
- URL: https://alinaderiparizi.com/blog/ai/machine-learning/deep-learning/python/pytorch/2023/03/22/pytorch-tutorial-1.html
- Date: 2023-03-22
- Kind: Blog post
- Topics: ai, machine-learning, deep-learning, python, pytorch
- Summary: A zero-to-one PyTorch tutorial: what a tensor and a gradient actually are, then linear and logistic regression built from scratch and rebuilt in PyTorch, step by step.
This is a **zero-to-one** tutorial: it doesn't assume you've used a deep learning framework before, only that you're comfortable reading Python. By the end of this part you'll understand what a tensor and a gradient actually are (not just how to type them), and you'll have trained two real models — a linear regressor and a logistic-regression classifier — first from scratch with plain arithmetic, then rebuilt the same models in PyTorch piece by piece, so you can see exactly what the framework is doing for you at each step.
# 1. What are we actually doing?
Before any code: a "model" in machine learning is just a function with some adjustable numbers in it, called **parameters** or **weights**. Training a model means searching for values of those numbers that make the function's output match reality as closely as possible, on examples you already know the answer to. Three ingredients make that search possible:
1. **Data** — input/output pairs you already know are correct (e.g., "this house is 80m² and sold for $200k").
2. **A loss function** — a single number that says how wrong the model's current output is compared to the real answer. Bigger loss, worse model.
3. **An optimization procedure** — a way to nudge every weight slightly in the direction that would have made the loss smaller. Do this enough times, on enough examples, and the weights converge to something useful.
That third ingredient is where PyTorch earns its keep. Computing "which direction would have made the loss smaller" for every weight in a large model, by hand, is exactly the kind of calculus that gets unmanageable past a few parameters. PyTorch's whole value proposition, distilled: it does that calculus for you automatically, and it does the (very repetitive) arithmetic on those weights fast, in parallel, ideally on a GPU. Everything in this post is really about those two things — automatic differentiation, and fast parallel arithmetic — with a specific framework's syntax wrapped around them.
# 2. What is PyTorch, actually
PyTorch is an open-source library for exactly the two things above: tensor computation with strong GPU acceleration, and automatic differentiation over arbitrary Python code. It was originally developed at Facebook AI Research (FAIR) and first released publicly in 2016 [1]; the design and engineering behind it were formally written up in Paszke et al.'s 2019 NeurIPS paper, which is still the right reference if you want the "why it's built this way" story from the people who built it [1]. In September 2022, Meta transferred PyTorch's governance to the independent, vendor-neutral **PyTorch Foundation** under the Linux Foundation, with AMD, AWS, Google Cloud, Meta, Microsoft Azure, and NVIDIA as founding members [2] — so today it isn't a single company's internal tool, it's genuinely community-governed infrastructure.
Two design choices explain most of what makes it pleasant to use, and both are worth naming because they're the actual reasons researchers reach for it over the alternatives:
- **Eager, define-by-run execution.** Older frameworks (TensorFlow 1.x, Theano) made you build a static computation graph first and run data through it afterward — closer to writing a program that writes a program. PyTorch runs your Python code line by line, immediately, the same way any other Python code does; the "graph" gets built implicitly as a side effect of running your code, not as a separate step you author. This makes debugging trivial — you can drop a `print()` or a debugger breakpoint anywhere, mid-model, and just look at real tensor values, because there's no separate compiled graph hiding them from you.
- **Reverse-mode automatic differentiation via a dynamic tape**, a design PyTorch adopted from the Chainer framework's "define-by-run" approach [3]. Every operation on a tensor that's tracking gradients gets recorded, in order, as it actually executes; running that tape backward afterward computes every gradient in one pass, using the chain rule. Because it's the *actual* executed operations being recorded (not a pre-declared static graph), the graph can be different on every single call — which matters for models whose structure depends on the input (variable-length sequences, tree-structured data, control flow).
Beyond that, it's simply a mature, actively maintained, Python-native project with excellent GPU support — which is most of why it's become the default in ML research and a large share of production systems.
# 3. Installing PyTorch
You can follow this tutorial using an online platform such as [Google Colab](https://colab.research.google.com) or [Kaggle](https://kaggle.com), which give you a Python environment through a Jupyter notebook and a proper GPU, more than enough for learning and even small projects or homework — both come with PyTorch already installed, so if you're just starting out, this is genuinely the path of least resistance and you can skip straight to [Section 4](#4-tensor-basics). If you want PyTorch on your own machine, here's how.
## 3.1 Installing PyTorch locally
The [official installer selector at pytorch.org](https://pytorch.org/get-started/locally/) [4] always has the current, correct command for your OS and CUDA version — treat it as the source of truth over any command frozen in a blog post, including this one, since exact package versions and CUDA compatibility shift over time.
If you haven't installed Anaconda on your machine, download and install it, then create a dedicated environment (isolating dependencies per project like this avoids a huge and common class of "it works on my other project but not this one" bugs):
```console
$ conda create --name torch python=3.9
```
After creating the environment, activate it:
```console
$ conda activate torch
```
Then use pip to install PyTorch. If your machine has an NVIDIA GPU and you want CUDA acceleration, use the command the installer selector gives you for your CUDA version; if you don't have a GPU, or just want the simplest possible install to follow along with this tutorial, the CPU-only build works identically for everything here, just slower on larger models:
```console
$ pip install torch torchvision torchaudio
```
It will take some time, but it will install PyTorch and, if applicable, its GPU requirements on your machine.
To check whether GPU acceleration is actually available in your install, open a Python file and run:
```python
import torch
print(f"Is GPU supported? {'Yes' if torch.cuda.is_available() else 'No'}")
```
```output
Is GPU supported? Yes
```
Getting `No` here isn't a failure — it just means everything below will run on CPU, which is perfectly fine for tensors and models this small. Well done, you have PyTorch installed and you're ready to go through this tutorial.
# 4. Tensor basics
The most basic class in the PyTorch library is the **tensor**. Almost every variable and operation in PyTorch is represented by a tensor — think of it as PyTorch's version of a NumPy array (a Python list generalizes to one dimension; a tensor generalizes to any number of them: a scalar is a 0-dimensional tensor, a vector is 1-D, a matrix is 2-D, a batch of RGB images is 4-D, and so on). The reason this specific abstraction exists, rather than just using Python lists, is that machine learning is fundamentally linear algebra — dot products, matrix multiplications, sums over large arrays — and a tensor library is what makes that fast: operations run as compiled, vectorized code (in C++/CUDA under the hood) instead of a slow Python `for` loop, and the exact same tensor can live on a CPU or be moved to a GPU to run in parallel across thousands of cores.
```python
import torch
# Creating tensors
sample_tensor = torch.tensor([2, 2])
random_tensor = torch.randn(2, 2) # random values, standard normal distribution
zero_tensor = torch.zeros(2, 2)
one_tensor = torch.ones(2, 2)
```
A few operations you'll reach for constantly:
```python
t = torch.tensor([[1, 2, 3], [4, 5, 6]])
t.shape # torch.Size([2, 3]) — dimensions, the single most useful thing to check when debugging
t[0] # tensor([1, 2, 3]) — indexing works like NumPy/Python lists
t[:, 1] # tensor([2, 5]) — slicing: every row, column 1
t.sum() # tensor(21)
t.mean() # only works on float tensors — int tensors will raise an error here
t + 10 # tensor([[11, 12, 13], [14, 15, 16]]) — elementwise, "broadcast" over every element
t.item() # only valid on a single-element tensor; pulls out a plain Python number
```
That last one, `.item()`, trips people up early on: a tensor is not a Python number, even a 0-dimensional one holding a single value — you'll see it throughout this tutorial whenever we need to print a loss as an ordinary float.
You can reshape a tensor with `.view()`, which behaves like NumPy's `reshape` (with one catch: `.view()` requires the underlying memory to be contiguous, which is the usual case for tensors you just created, but can bite you after certain operations like `.transpose()` — if you ever hit a `RuntimeError` about a view needing contiguous memory, calling `.reshape()` instead, or `.contiguous()` first, is the fix):
```python
sample_tensor = torch.tensor([[1, 2, 3, 4 ],
[5, 6, 7, 8 ],
[9, 10, 11, 12],
[13, 14, 15, 16]])
# turn into a 1-D tensor ([1, 2, 3, ..., 16])
one_dimension_tensor = sample_tensor.view(16, 1)
```
Tensors interoperate with NumPy directly and cheaply — `torch.from_numpy(array)` wraps a NumPy array as a tensor without copying its data, and `tensor.numpy()` goes the other way — which is why you'll see both libraries mixed freely in the same script; most datasets get loaded and preprocessed with NumPy/pandas/scikit-learn, then handed to PyTorch at the model boundary.
Tensors can live on the CPU or the GPU, and math between two tensors requires both to be on the *same* device — a very common beginner error is a `RuntimeError` about tensors on different devices, usually because one tensor got moved to the GPU and another didn't. Move a tensor with `.to(...)`:
```python
device = torch.device('cuda' if torch.cuda.is_available() else 'cpu')
sample_tensor = torch.tensor([2, 2])
sample_tensor = sample_tensor.to(device) # now lives on `device`
```
Writing `device` once like that, driven by `torch.cuda.is_available()`, and reusing it everywhere, is the standard pattern for code that should run unmodified whether or not a GPU is present — you'll see it throughout the rest of this series.
## 4.1 Operations and gradient calculation
Every calculation you run on tensors that have gradient-tracking turned on gets recorded by PyTorch as a **computation graph** — a record of exactly which operations produced which values, in order. Take a tiny example: `y = (x * w).sum()`. As Python executes that line, PyTorch is quietly building this graph behind the scenes:
Figure 1: computation graph for a multiply followed by a sum
That graph is what makes automatic gradient calculation possible: to know how much the final output `y` would change if we nudged `w` slightly, PyTorch walks this graph *backward*, from `y` to `w`, applying the chain rule at every step it passes through — exactly the calculus you'd do by hand for a small expression like this one, just done automatically and for expressions with millions of operations. This one calculation — "how sensitive is the loss to each weight" — is the gradient, and it's the single quantity every training loop in this post exists to compute and then act on.
To make a tensor participate in this recording, set `requires_grad=True` when you create it (only tensors you'll be *optimizing* — your model's weights — normally need this; your input data doesn't). Once you've computed a final scalar value (like a loss), calling `.backward()` on it walks the whole graph backward and populates `.grad` on every tensor that required gradients:
```python
x = torch.tensor([1., 2., 3., 4.])
w = torch.randn(1, requires_grad=True)
y = (x * w).sum()
y.backward()
print(f"dy/dw: {w.grad}")
```
A couple of things worth knowing before you hit them as confusing errors later: calling `.backward()` on anything that *isn't* a single scalar will raise an error unless you pass it an explicit gradient argument, because "the gradient of a vector with respect to another vector" isn't a single well-defined thing the way it is for a scalar loss — this is part of why every loss function you'll see in this post reduces its output to one number (with `.mean()` or `.sum()`) before anything gets trained on it. And gradients **accumulate** by default — calling `.backward()` twice adds the new gradients on top of the old ones rather than replacing them, which is exactly why every training loop later in this post explicitly zeroes gradients out before each new backward pass; forgetting that line is one of the most common silent bugs in PyTorch code (the model still trains, just wrong, since gradients from old steps keep leaking into new ones).
If you want to build this exact mechanism yourself, by hand, in about 150 lines of Python — genuinely worth doing once, to fully de-mystify what `.backward()` is doing — Andrej Karpathy's *micrograd* walkthrough builds a tiny autograd engine from scratch and is the best beginner-level treatment of this I know of [5].
# 5. Linear regression
Learning by doing a real project is the fastest way to build intuition, especially with a new framework. We'll implement linear regression three times, each version building on the last: from scratch with plain NumPy (no PyTorch at all, so you see exactly what's being computed), then converted to PyTorch tensors with manual gradient updates (so you see exactly what `.backward()` replaces), then finally using PyTorch's built-in optimizer, loss function, and layer classes (so you see what you actually write day to day). Linear regression is also, not coincidentally, the smallest possible neural network — a single neuron, with one weight and no activation function — so everything you learn about training it generalizes directly to bigger networks later in this series.
## 5.1 Problem statement
Simple linear regression estimates the relationship between two quantitative variables by fitting a straight line through observed data. It answers questions like:
1. How strong is the relationship between two variables? (e.g., rainfall and soil erosion)
2. What value would the dependent variable take at a given value of the independent variable? (e.g., expected erosion at a specific rainfall level)
The formula for simple linear regression:
$$ y = \beta_{0} + \beta_{1} \cdot X + \epsilon $$
- **$$y$$** is the predicted value of the dependent variable for a given $$x$$.
- **$$\beta_0$$** is the intercept — the predicted $$y$$ when $$x = 0$$.
- **$$\beta_1$$** is the regression coefficient — how much $$y$$ changes as $$x$$ increases by 1.
- **$$x$$** is the independent variable.
- **$$\epsilon$$** is the error — the gap between the line's prediction and the real data.
Linear regression finds the line of best fit by searching for the coefficient $$\beta_1$$ that minimizes total error. That "total error" is measured by a **loss function** — here, **M**ean **S**quared **E**rror (MSE), which squares each prediction's error (so positive and negative errors don't cancel out, and big misses are punished disproportionately more than small ones) and averages over all examples:
$$L = \frac{1}{N} \sum_{i=1}^{N} (\hat{Y}_{i} - Y_{i})^2$$
To minimize that loss, we repeatedly nudge the weight in the direction that reduces it — this is **gradient descent**, and it's the "optimization procedure" from Section 1 made concrete:
$$ w = w - \alpha \cdot \frac{dJ}{dw} $$
Here $$\alpha$$ (alpha) is the **learning rate** — how big a step to take on each update. Too small, and training crawls; too large, and updates can overshoot and diverge instead of converging (worth remembering: if a training loop's loss explodes to `NaN` or grows instead of shrinking, an oversized learning rate is the first thing to suspect). $$\frac{dJ}{dw}$$ — the gradient — is exactly the quantity from Section 4.1 that tells us which direction reduces the loss, and for this specific loss and model it works out to:
$$ \frac{dJ}{dw} = \frac{1}{N} \cdot 2x \cdot (\hat{y}-y) $$
You won't need to derive that formula yourself once PyTorch is doing the differentiation — but seeing it once, and then implementing it by hand below, is exactly what makes `.backward()` feel like less of a black box.
For this example we'll use a deliberately trivial training set — 2D points $$(x, y)$$ where $$y = 2 \times x$$ — specifically *because* the right answer ($$w=2$$) is obvious, so it's easy to tell at a glance whether training actually worked:
| x | y |
|---|---|
| 1 | 2 |
| 2 | 4 |
| 3 | 6 |
| 4 | 8 |
| 5 | 10|
| 6 | 12|
We'll hold out $$x=6$$ as a test point the model never trains on, and use the rest as training data:
```python
import numpy as np
# Training Data
X = np.array([1,2,3,4,5], dtype=np.float32)
Y = np.array([2,4,6,8,10], dtype=np.float32)
# Test Data
x_test = np.array([6], dtype=np.float32)
y_test = np.array([12], dtype=np.float32)
```
The network will have a single node with a single parameter $$w$$, initialized to a random value (training's whole job is to move this random guess toward the correct one):
```python
# Weights: a single node (no bias for now)
w = np.random.rand()
```
We'll structure this from-scratch implementation the same way PyTorch structures its own models: with a `forward` function that computes the network's output from its input and weights. It's a small bit of extra ceremony here, but it means the switch to actual PyTorch in [Section 5.2](#52-including-pytorch) will feel completely familiar.
```python
# Forward pass:
# Predict the output of the network on the input data.
def forward(x, weights):
return x * weights
```
Then the loss function — MSE, as derived above:
```python
# Model loss function:
# MSE = 1/N * sum((y_i - y_hat_i)^2)
def mse(y, y_pred):
return np.mean(np.square(y - y_pred))
print(f'prediction before training f({x_test}): {forward(x_test, w)}')
```
And a function to compute the gradient — in PyTorch, this entire function is what `.backward()` replaces:
```python
# Calculating gradients:
# dJ/dw = 1/N * 2x * (w*x - y) // note: w*x is y_pred
def backward(x, y, w):
return np.dot(2*x, (w*x - y)).mean()
```
And finally, the training loop — this exact shape (forward pass, compute loss, backward pass, update weights, repeat) is the shape of *every* training loop you'll write, in this post and beyond:
```python
learning_rate = 0.01 # alpha
num_epochs = 100 # one epoch = one full pass over the training data
for epoch in range(num_epochs):
# Forward pass: compute predicted y by passing x through the model
Y_pred = forward(X, w)
# Compute the loss, just to track/print it
loss = mse(Y, Y_pred)
# Backward pass: compute the gradient of the loss w.r.t. the model's weight
dw = backward(X, Y, w)
# Update the weight
w = w - learning_rate * dw
if epoch % 10 == 0:
print(f"Epoch: {epoch} loss={loss:0.3f}, weights={[w]}")
print(f"Model prediction for x=6 is: {forward(x_test, w)}")
```
```output
Epoch: 0 loss=24.130, weights=[2.14810945503594]
Epoch: 10 loss=0.000, weights=[2.0000000976789147]
Epoch: 20 loss=0.000, weights=[2.0000000976789147]
Epoch: 30 loss=0.000, weights=[2.0000000976789147]
Epoch: 40 loss=0.000, weights=[2.0000000976789147]
Epoch: 50 loss=0.000, weights=[2.0000000976789147]
Epoch: 60 loss=0.000, weights=[2.0000000976789147]
Epoch: 70 loss=0.000, weights=[2.0000000976789147]
Epoch: 80 loss=0.000, weights=[2.0000000976789147]
Epoch: 90 loss=0.000, weights=[2.0000000976789147]
Model prediction for x=6 is: [12.]
```
The model converged well before 100 iterations and correctly predicted $$y=12$$ for the held-out $$x=6$$ — not because it memorized that pair (it never saw it during training), but because it learned the actual underlying rule, $$y = 2x$$.
## 5.2 Including PyTorch
Now let's bring PyTorch in, one piece at a time. First, every variable ($$x$$, $$y$$, $$w$$) becomes a tensor instead of a NumPy array:
```python
import torch
# Training Data
X = torch.tensor([1,2,3,4,5], dtype=torch.float32)
Y = torch.tensor([2,4,6,8,10], dtype=torch.float32)
# Test Data
x_test = torch.tensor([6], dtype=torch.float32)
y_test = torch.tensor([12], dtype=torch.float32)
# Weights: a single neuron
w = torch.randn(1, requires_grad=True, dtype=torch.float32)
```
Notice `requires_grad=True` on `w` specifically — per Section 4.1, that's what tells PyTorch to track this tensor's operations for differentiation. `X` and `Y` don't need it; we're never going to compute a gradient *with respect to the data*, only with respect to the weight. Forgetting `requires_grad=True` here is a common early mistake — calling `.backward()` later will raise an error, because the tensor was never recorded onto the computation graph in the first place.
Forward pass and loss function, unchanged in spirit from the NumPy version, just written with tensor operations:
```python
# Forward pass:
# Predict the output of the network on the input data.
def forward(x, weights):
return x * weights
# Model loss function:
# MSE = 1/N * sum((y_i - y_hat_i)^2)
def mse(y, y_pred):
return ((y - y_pred) ** 2).mean()
```
There's no `backward` function to write this time — that's the entire point. Calling `.backward()` on the loss computes every gradient PyTorch needs, and stores it on `w.grad`. Two details matter once you do this in a loop: gradients accumulate (per Section 4.1) so we must zero them each iteration with `w.grad.zero_()`, and the weight update itself must happen *outside* gradient tracking — wrapped in `with torch.no_grad():` — because "subtract the gradient from the weight" is itself a tensor operation, and we don't want *that* operation recorded onto the graph for next time.
```python
learning_rate = 0.01
num_epochs = 100
for epoch in range(num_epochs):
y_pred = forward(X, w)
loss = mse(Y, y_pred)
loss.backward()
with torch.no_grad():
w -= learning_rate * w.grad
# zero the gradient before the next backward() call — see Section 4.1
w.grad.zero_()
if epoch % 10 == 0:
print(f"Epoch: {epoch} loss={loss:0.3f}, weights={w}")
print(f"Model prediction for x=6 is: {forward(x_test, w)}")
```
```output
Epoch: 0 loss=49.172, weights=tensor([0.9472], requires_grad=True)
Epoch: 10 loss=0.139, weights=tensor([1.9122], requires_grad=True)
Epoch: 20 loss=0.001, weights=tensor([1.9927], requires_grad=True)
Epoch: 30 loss=0.000, weights=tensor([1.9994], requires_grad=True)
Epoch: 40 loss=0.000, weights=tensor([1.9999], requires_grad=True)
Epoch: 50 loss=0.000, weights=tensor([2.0000], requires_grad=True)
Epoch: 60 loss=0.000, weights=tensor([2.0000], requires_grad=True)
Epoch: 70 loss=0.000, weights=tensor([2.0000], requires_grad=True)
Epoch: 80 loss=0.000, weights=tensor([2.0000], requires_grad=True)
Epoch: 90 loss=0.000, weights=tensor([2.0000], requires_grad=True)
Model prediction for x=6 is: tensor([12.0000], grad_fn=)
```
Same result as the NumPy version, but the gradient was never derived or coded by hand — `loss.backward()` did section 5.1's `backward()` function for us, automatically, for whatever loss function we'd written.
## 5.3 Using PyTorch's built-in layers and optimizer
Manually subtracting `learning_rate * w.grad` is itself boilerplate PyTorch can take over. Instead of hand-updating weights, we use an **optimizer** — Stochastic Gradient Descent (SGD) here, though PyTorch ships several (Adam being the other one you'll see constantly). And instead of a bare weight `w`, we use a built-in layer, `torch.nn.Linear(input_size, output_size)`, which is precisely a single linear neuron like ours — it creates and owns its own weight (and, by default, a bias term $$\beta_0$$) internally, so we no longer define `w` ourselves at all.
```python
import torch
# Training Data — note the shape: PyTorch's nn.Linear expects each
# sample as its own row, so a "5 samples, 1 feature" tensor is 5x1, not flat.
X = torch.tensor([[1],[2],[3],[4],[5]], dtype=torch.float32)
Y = torch.tensor([[2],[4],[6],[8],[10]], dtype=torch.float32)
# Test Data
x_test = torch.tensor([6], dtype=torch.float32)
y_test = torch.tensor([12], dtype=torch.float32)
n_samples, n_features = X.shape
input_size = n_features # 1 input value per sample
output_size = 1 # 1 output value per sample — we set this explicitly,
# rather than reusing n_features, because input and
# output size are conceptually independent; they only
# happen to both be 1 in this particular example.
model = torch.nn.Linear(input_size, output_size)
print(f'prediction before training f({x_test}): {model(x_test).item():.3f}')
learning_rate = 0.01
num_epochs = 2000
optimizer = torch.optim.SGD(model.parameters(), lr=learning_rate)
loss_fn = torch.nn.MSELoss()
for epoch in range(num_epochs):
y_pred = model(X)
# PyTorch loss functions take (prediction, target) — that order matters
# for losses that aren't symmetric (MSE happens to not care, but get in
# the habit now, because most losses do).
loss = loss_fn(y_pred, Y)
loss.backward()
optimizer.step() # applies every parameter's update, using its .grad
optimizer.zero_grad() # equivalent to calling .grad.zero_() on every parameter
if epoch % 500 == 0:
print(f"Epoch: {epoch} loss={loss.item():0.5f}, weight={model.weight.item():0.5f}")
print(f"{model(x_test).item():0.3f}")
```
```output
prediction before training f(tensor([6.])): 0.314
Epoch: 0 loss=45.60832, weight=0.29675
Epoch: 500 loss=0.00051, weight=1.98523
Epoch: 1000 loss=0.00002, weight=1.99979
Epoch: 1500 loss=0.00000, weight=1.99999
12.000
```
`optimizer.step()` and `optimizer.zero_grad()` are doing exactly what section 5.2's manual `with torch.no_grad(): w -= learning_rate * w.grad` and `w.grad.zero_()` did — just generalized to work over *every* parameter in a model automatically, which matters enormously once a model has thousands or millions of them and hand-updating each one individually stops being an option.
## 5.4 Wrapping the model in a Module
Real models are rarely a single `nn.Linear` call — they're stacks of layers. PyTorch's convention for this is a **Module**: a class inheriting from `torch.nn.Module` that owns some layers in `__init__` and defines how data flows through them in `forward`.
```python
class Model(torch.nn.Module):
def __init__(self, input_size, output_size):
super(Model, self).__init__()
self.ll_1 = torch.nn.Linear(input_size, output_size)
def forward(self, x):
return self.ll_1(x)
```
`torch.nn.Module` is what makes `model.parameters()` (used above by the optimizer) automatically discover every weight in every layer you assign as an attribute in `__init__` — you never register parameters by hand, the base class does it via a bit of Python attribute-assignment magic. Using this `Model` class is a drop-in replacement for the bare `nn.Linear` from Section 5.3:
```python
model = Model(input_size, output_size)
optimizer = torch.optim.SGD(model.parameters(), lr=learning_rate)
loss_fn = torch.nn.MSELoss()
for epoch in range(num_epochs):
y_pred = model(X)
loss = loss_fn(y_pred, Y)
loss.backward()
optimizer.step()
optimizer.zero_grad()
if epoch % 500 == 0:
print(f"Epoch: {epoch} loss={loss.item():0.5f}, weight={model.ll_1.weight.item():0.5f}")
print(f"{model(x_test).item():0.3f}")
```
This is the pattern practically every PyTorch model you'll ever see follows, from a single linear layer up to a modern transformer: subclass `nn.Module`, declare layers in `__init__`, wire them together in `forward`.
## 5.5 A more realistic example
Our toy dataset was exactly linear on purpose, to make correctness obvious. Real data has noise. Let's generate a noisy synthetic dataset with scikit-learn and plot the fitted line with matplotlib, to see the model doing something closer to real regression:
```python
import torch
from sklearn import datasets
import matplotlib.pyplot as plt
import numpy as np
dataset = datasets.make_regression(n_samples=20, n_features=1, noise=20, random_state=1)
X, Y = torch.from_numpy(dataset[0].astype(np.float32)), torch.from_numpy(dataset[1].astype(np.float32))
Y = Y.view(Y.shape[0], 1)
n_samples, n_features = X.shape
class Model(torch.nn.Module):
def __init__(self, input_size, output_size):
super(Model, self).__init__()
self.ll_1 = torch.nn.Linear(input_size, output_size)
def forward(self, x):
return self.ll_1(x)
model = Model(n_features, 1)
criterion = torch.nn.MSELoss()
optimizer = torch.optim.SGD(model.parameters(), lr=0.01)
num_epochs = 1000
for epoch in range(num_epochs):
y_pred = model(X)
loss = criterion(y_pred, Y)
loss.backward()
optimizer.step()
optimizer.zero_grad()
if (epoch+1) % 10 == 0:
print(f'Epoch: {epoch+1}, Loss: {loss.item():.4f}')
# .detach() drops a tensor's gradient-tracking (per Section 4.1) so it can be
# safely handed to NumPy/matplotlib, which know nothing about autograd.
prediction = model(X).detach().numpy()
plt.plot(X.detach().numpy(), Y.detach().numpy(), 'ro')
plt.plot(X.detach().numpy(), prediction, 'b')
```
Figure 2: regression results — the fitted line (blue) through noisy data (red)
# 6. Logistic regression
Linear regression predicts a continuous number. **Classification** — predicting one of a fixed set of categories — needs a different output shape and a different loss, but reuses everything else we've built. Here's a real classification example using the breast cancer dataset bundled with scikit-learn: predicting whether a tumor is malignant or benign from 30 measured features, using a single neuron, just like before.
Two changes from linear regression, both worth understanding rather than memorizing: a linear layer's raw output can be any real number, but we want a *probability* (something between 0 and 1), so we pass it through the **sigmoid** function, which squashes any real number into that range; and for probabilities specifically, MSE is a poor loss (it doesn't punish confidently-wrong predictions harshly enough), so we use **Binary Cross-Entropy (BCE)** loss instead, which does.
```python
import torch
import matplotlib.pyplot as plt
import numpy as np
from sklearn.datasets import load_breast_cancer
from sklearn.model_selection import train_test_split
from sklearn.preprocessing import StandardScaler
dataset = load_breast_cancer()
X, y = dataset.data, dataset.target
n_samples, n_features = X.shape
x_train, x_test, y_train, y_test = train_test_split(X, y, test_size=0.2, random_state=42)
# Feature scaling matters here in a way it didn't for our toy example:
# the 30 features are on wildly different scales (e.g. "mean radius" vs.
# "mean area"), and gradient descent converges far more reliably when every
# feature is on a comparable scale. Fit the scaler on training data only,
# then apply the same transform to the test set — fitting on test data would
# leak information from the test set into training.
scaler = StandardScaler()
x_train = scaler.fit_transform(x_train)
x_test = scaler.transform(x_test)
x_train = torch.from_numpy(x_train.astype(np.float32))
x_test = torch.from_numpy(x_test.astype(np.float32))
y_train = torch.from_numpy(y_train.astype(np.float32))
y_test = torch.from_numpy(y_test.astype(np.float32))
y_train = y_train.view(y_train.shape[0], 1)
y_test = y_test.view(y_test.shape[0], 1)
class LogisticRegression(torch.nn.Module):
def __init__(self, num_features):
super(LogisticRegression, self).__init__()
self.linear = torch.nn.Linear(num_features, 1)
def forward(self, x):
y_pred = torch.sigmoid(self.linear(x))
return y_pred
model = LogisticRegression(n_features)
criterion = torch.nn.BCELoss()
optimizer = torch.optim.SGD(model.parameters(), lr=0.01)
for epoch in range(100):
y_pred = model(x_train)
loss = criterion(y_pred, y_train)
loss.backward()
optimizer.step()
optimizer.zero_grad()
if epoch % 10 == 0:
# We don't need gradients for evaluation — only for training — so we
# turn tracking off here, same idea as torch.no_grad() in Section 5.2.
with torch.no_grad():
prediction = model(x_test).round()
accuracy = prediction.eq(y_test).sum().item() / len(y_test)
print(f'epoch: {epoch}, loss: {loss.item():.03f}, accuracy: {accuracy:.03f}')
```
As in the training loop, when we only want to *read* a value (like accuracy) rather than train on it, we don't need gradient tracking. `torch.no_grad()` turns it off for an entire block; the equivalent for a single tensor is `.detach()`, which returns a copy of the tensor that's no longer connected to the computation graph:
```python
a = torch.tensor([1, 2, 3], dtype=torch.float32, requires_grad=True)
a_copy = a.detach() # same values, but detached from the graph
```
```output
epoch: 0, loss: 0.892, accuracy: 0.281
epoch: 10, loss: 0.650, accuracy: 0.667
epoch: 20, loss: 0.515, accuracy: 0.860
epoch: 30, loss: 0.433, accuracy: 0.939
epoch: 40, loss: 0.380, accuracy: 0.947
epoch: 50, loss: 0.342, accuracy: 0.965
epoch: 60, loss: 0.315, accuracy: 0.965
epoch: 70, loss: 0.293, accuracy: 0.965
epoch: 80, loss: 0.276, accuracy: 0.965
epoch: 90, loss: 0.262, accuracy: 0.965
```
96.5% accuracy from a single neuron, no hidden layers at all — a reasonable reminder that a lot of real classification problems are closer to linear than intuition suggests.
# 7. Conclusion
Starting from "what does training even mean," we built up to tensors, autograd, and the computation graph that makes `.backward()` possible; then implemented linear regression three times — from scratch, with manual PyTorch gradients, and with built-in optimizers and layers — so each abstraction had something concrete underneath it before we started trusting it; then reused every piece of that for a real logistic regression classifier. That five-line training loop (forward, loss, backward, step, zero_grad) is the actual core of this entire post, and it's the same five lines whether the model has one parameter or one billion.
[Part 2](https://alinaderiparizi.com/blog/ai/machine-learning/deep-learning/python/pytorch/2023/03/27/pytorch-tutorial-2.html) picks up where the raw NumPy arrays in this post get replaced with something that scales: PyTorch's `Dataset` and `DataLoader`, for when your data doesn't fit conveniently in five lines of Python.
# References
1. A. Paszke, S. Gross, F. Massa, A. Lerer, et al. PyTorch: An Imperative Style, High-Performance Deep Learning Library. *Advances in Neural Information Processing Systems 32 (NeurIPS 2019)*, pp. 8024–8035. [papers.nips.cc](https://papers.nips.cc/paper/9015-pytorch-an-imperative-style-high-performance-deep-learning-library)
2. Linux Foundation. Meta Transitions PyTorch to the Linux Foundation. September 2022. [linuxfoundation.org](https://www.linuxfoundation.org/press/press-release/meta-transitions-pytorch-to-the-linux-foundation)
3. S. Tokui, K. Oono, S. Hido, J. Clayton. Chainer: a Next-Generation Open Source Framework for Deep Learning. *NeurIPS Workshop on Machine Learning Systems*, 2015.
4. PyTorch. Get Started: Locally. [pytorch.org/get-started/locally](https://pytorch.org/get-started/locally/)
5. A. Karpathy. The spelled-out intro to neural networks and backpropagation: building micrograd. *Neural Networks: Zero to Hero*. [github.com/karpathy/micrograd](https://github.com/karpathy/micrograd) · [video](https://www.youtube.com/watch?v=VMj-3S1tku0)
6. PyTorch. `torch.Tensor` documentation. [pytorch.org/docs/stable/tensors.html](https://pytorch.org/docs/stable/tensors.html)
7. PyTorch. Autograd mechanics. [pytorch.org/docs/stable/notes/autograd.html](https://pytorch.org/docs/stable/notes/autograd.html)
---
# The Subtle Art of Not Giving a Fuck
- URL: https://alinaderiparizi.com/book/self-help/focus/study-lessens/2023/03/22/the-art-of-dont-giving-a-fuck.html
- Date: 2023-03-22
- Kind: Book review
- Topics: self-help, focus, study-lessens
- Summary: A Counterintuitive Approach to Living a Good Life is a 2016 nonfiction self-help book by American blogger and author Mark Manson. The book covers Manson's belief that life's struggles give it meaning and argues that typical self-help books offer meaningless positivity which is neither practical nor helpful, thus improperly approaching the problems many individuals face. It was a New York Times and Globe and Mail bestseller.
# 1. Intro
There's nothing subtle about Mark Manson. He's crude, vulgar and doesn't give a f*ck.
But like anything of true value in life, dig a little deeper and you'll find treasure worthy of any explorer willing to look below the surface.
I recently interviewed Mark about his new book, The Subtle Art of Not Giving a F*ck: A Counterintuitive Approach to Living a Good Life, and found that the man behind the profanity is actually incredibly inspiring, deeply philosophical, and extremely clever.
So clever in fact that he's brilliantly disguised his book using language as a way of tricking the reader into reading a book about values.
At its core, The Subtle Art of Not Giving a F*ck is a book about finding what's truly important to you and letting go of everything else. In the same way that he encourages limiting exposure to mindless distractions such as social media, television and technology, he encourages limiting concern over things that have little to no meaning or value in your life.
In our interview, Mark said, "If seeing things online or hearing things your co-workers say is really affecting you that much then you need to look at the values in your life. If your emotions are constantly being pushed this way or that way, and you feel like you're never in control, it's probably because you're valuing a lot of the wrong things."
More than a practical guidebook to choosing what's important in our lives and what's unimportant, it's a brutally honest and much needed reality check about our personal problems, fears and expectations. It's a bold confrontation of self, our painful truths, faults and uncertainties, without all the positive airy fairy fluff we've been spoon-fed to believe by self-help gurus.
# 2. Think positive?
"Fuck positivity," Manson says. "Let's be honest; sometimes things are fucked up and we have to live with it."
Be extraordinary?
"Not everyone can be extraordinary - there are winners and losers in society, and some if it is not fair or your fault," Manson writes.
Seek happiness?
"The path to happiness is a path full of shit heaps and shame," he remarks.
By far, my favorite quote in the book. And I'm an incessant happiness seeker.
Reading Mark's book, I laughed until I snorted and cried until I shriveled. He's as painfully honest as he is outrageously funny. I find his honesty to be refreshing and fulfilling. When every other self-help book injects you with cheap, feel-good highs that last as long as your nose remains buried in the book and serves no practical purpose out in the mud and grime of your daily life, Mark's book yanks you out of delusion and denial, points at the pit you're stuck in and forces you to not only look at the filth and dirt covering you but also to accept it.
This, he says, is the real source of empowerment. "Once we embrace our fears, faults and uncertainties - once we stop running from and avoiding, and start confronting painful truths - we can begin to find the courage and confidence we desperately seek."
Instead of aiming for an unattainably perfect, problem free, feel-good life, Mark suggests asking the essential question, "What problem do you want to have?"
If it's true what he writes, that "Life is essentially an endless series of problems. The solution to one problem is merely the creation of another," then it makes sense when he tells me that life sucks for those who constantly try to get away from problems. Instead of asking "how can I get rid of my problems?" the question becomes, "What are the problems that excite me? What are the problems for which I am willing to sacrifice for, to work for?"
"Predicated on peddling highs to people rather than solving legitimate problems," he calls the modern self-help market the "french fries and soda version of personal growth". "It's really good and easy to consume... but there is an inherently painful and difficult struggle as part of growth and if you are never willing to hit people on the face with that, most people are just gonna avoid it... They're just going to keep finding more feel-good stuff to distract themselves with."
As any fast food restaurant can tell you, there's a lot of money to be made in french fries and soda. And with the self-improvement industry netting $11 billion a year in the US alone, it's no wonder the market is saturated with touchy feely everything-is-awesome french fries. You can practically lick the hope off your fingers along with the salt.
Manson, on the other hand, offers no hope in his book. At least, not on the surface. "This book doesn't give a fuck about alleviating your problems or your pain," he writes. "This book is not some guide to greatness - it couldn't be, because greatness is merely an illusion in our minds, a made-up destination that we obligate ourselves to pursue, our own psychological Atlantis."
The irony is the book actually is about greatness. It is hopeful. There's greatness to be discovered in accepting our lack of greatness, our simplicity and beauty amidst the complex and ugly. And in embracing our problems along with the dirt, muck and grime that essentially accompany life and humanity, we come to live the good life we always yearned for.
The Subtle Art of Not Giving a F*ck: A Counterintuitive Approach to Living a Good Life is a deeply inspiring book about values and purpose cleverly disguised in crude four-letter vulgarity, negativity and apocalyptic doom.
There are no soft puffy cloud prancing unicorns offering hugs on colorful rainbows, only F-bomb explosions and brutal smack-you-in-the-face reality slaps.
But by the time you finish reading it, you'll find yourself tingling with promise. The world suddenly seems brighter and lighter. You'll feel free, and oddly, good, despite the shit sandwiches served throughout the book. And it won't be the surfacey french fry kind of good that makes your body crave real nourishment, but the kind of home-cooked-goodness good that warms you from deep within, like you've just been served a hearty platter of whole, raw, organic, unfiltered truth.
# References
1. M. Manson. *The Subtle Art of Not Giving a F\*ck: A Counterintuitive Approach to Living a Good Life*. HarperOne, 2016. ISBN 978-0-06-245771-4. [Official book page](https://markmanson.net/books/subtle-art)
---
# Adversarial attacks in deep learning
- URL: https://alinaderiparizi.com/blog/ai/machine-learning/deep-learning/2023/03/21/adverserial-attack.html
- Date: 2023-03-21
- Kind: Blog post
- Topics: ai, machine-learning, deep-learning
- Summary: Are the machine learning models we use intrinsically flawed?
# 1. Intro
Big Data powered machine learning and deep learning has yielded impressive advances in many fields. One example is the release of ImageNet, consisting of more than 15 million labeled, high-resolution images across 22,000 categories, which revolutionized the field of computer vision. State-of-the-art models have already achieved 98% top-five accuracy on the ImageNet dataset, so it seems as though these models are foolproof and that nothing can go wrong.
However, recent advances in adversarial training have found that this is an illusion. A good model misbehaves frequently when faced with adversarial examples. The image below illustrates the problem:
The model initially classifies the panda picture correctly, but when some noise, imperceptible to human beings, is injected into the picture, the resulting prediction of the model is changed to another animal, gibbon, even with such a high confidence. To us, it appears as if the initial and altered images are the same, although it is radically different to the model. This illustrates the threat these adversarial attacks pose — we may not perceive the difference so we cannot tell an adversarial attack as happened. Hence, although the output of the model may be altered, we cannot tell if the output is correct or incorrect.
This formed the motivation behind Professor Ling Liu's keynote speech at the 2019 IEEE Big Data Conference, where she touched on types of adversarial attacks, how adversarial examples are generated, and how to defend against these attacks. Without further ado, I will get into the contents of her speech.
# 2. Types of adversarial attacks
Adversarial attacks are classified into two categories — targeted attacks and untargeted attacks.
The targeted attack has a target class, Y, that it wants the target model, M, to classify the image I of class X as. Hence, the goal of the targeted attack is to make M misclassify by predicting the adversarial example, I, as the intended target class Y instead of the true class X. On the other hand, the untargeted attack does not have a target class which it wants the model to classify the image as. Instead, the goal is simply to make the target model misclassify by predicting the adversarial example, I, as a class, other than the original class, X.
Researchers have found that in general, although untargeted attacks are not as good as targeted attacks, they take much less time. Targeted attacks, although more successful in altering the predictions of the model, come at a cost (time).
# 3. How are Adversarial Examples Generated
Having understood the difference between targeted and untargeted attacks, we now come to the question of how these adversarial attacks are carried out. In a benign machine learning system, the training process seeks to minimize the loss between the target label and the predicted label, formulated mathematically as such:
$$ \theta^{*} = \underset{\theta}{\mathrm{argmin}} \; \frac{1}{N}\sum_{i=1}^{N} L\big(H_{\theta}(x_i), y_i\big) $$
During the testing phase, the learned model is tested to determine how well it can predict the predicted label. Error is then calculated by the sum of the loss between the target label and the predicted label, formulated mathematically as such:
$$ \mathrm{Error} = \sum_{i=1}^{N} L\big(H(x_i), y_i\big) $$
In adversarial attacks, the following 2 steps are taken:
1. The query input is changed from the benign input x to $$x^\prime$$.
2. An attack goal is set such that the prediction outcome, $$H(x)$$ is no longer $$y$$. The loss is changed from $$L(H(x_i), y_i)$$ to $$L(H(x_i), y^{\prime}_i)$$ where $$y^{\prime}_i \ne y_i$$.
# 4. Adversarial Perturbation
One way the query input is changed from x to x’ is through the method called “adversarial perturbation”, where the perturbation is computed such that the prediction will not be the same as the original label. For images, this can come in the form of pixel noise as we saw above with the panda example. Untargeted attacks have the single goal of maximizing the loss between H(x) and H(x’) until the prediction outcome is not y (the real label). Targeted attacks have an additional goal of not only maximizing the loss between H(x) and H(x’) but also to minimize the loss between H(x’) and y’ until H(x’) = y’ instead of y.
Adversarial perturbation can then be categorized into one-step and multi-step perturbation. As the names imply, the one-step perturbation only involves a single stage — add noise once and that is it. On the other hand, the multi-step perturbation is an iterative attack that makes small modifications to the input each time. Therefore, the one-step attack is fast but excessive noise may be added, hence making it easier for humans to detect the changes. Furthermore, it places more weight on the objective of maximizing loss between H(x) and H(x’) and less on minimizing the amount of perturbation. Conversely, the multi-step attack is more strategic as it introduces small amounts of perturbation at each time. However, this also means such an attack is computationally more expensive.
# 5. Black Box VS White Box Attacks
Now that we have looked at how adversarial attacks are generated, some astute readers may realize one fundamental assumption these attacks take on — that the attack target prediction model, H, is known to the adversary. Only when the targeted model is known can it be compromised to generate adversarial examples by changing the input. However, attackers do not always know or have access to the targeted model. This may sound like a surefire way to ward off these adversarial attackers, but the truth is that black box attacks are also highly effective.
Black box attacks are based on the notion of transferability of adversarial examples — the phenomenon whereby adversarial examples, although generated to attack a surrogate model G, can achieve impressive results when attacking another model H. The steps taken are as follows:
1. The attack target prediction model H is privately trained and unknown to the adversary.
2. A surrogate model G, which mimics H, is used to generate adversarial examples.
3. By using the transferability of adversarial examples, black box attacks can be launched to attack H.
This attack can be launched either with the training dataset being known or unknown. In the case where the dataset is known to the adversary, the model G can be trained on the same dataset as model H to mimic H.
When the training dataset is unknown, however, adversaries can leverage Membership Inference Attacks, whereby an attack model whose purpose is to distinguish the target model’s behavior on the training inputs from its behavior on the inputs it did not encounter during training is trained. In essence, this turns into a classification problem to recognize differences in the target model’s predictions on the inputs that it trained on versus the inputs that it did not train on. This enables the adversary to obtain a better sense of the training dataset D which model H was trained on, enabling the attacker to generate a shadow dataset S on the basis of the true training dataset so as to train the surrogate model G. Having trained G on S where G mimics H and S mimics D, black box attacks can then be launched on H.
## 5.1 Black Box Attacks
Now that we have seen how black box attacks vary from white box attacks in that the target model H is unknown to the adversary, we will cover the various tactics used in black box attacks. Beyond the transferability-based approach described above (train a surrogate model and hope the adversarial examples transfer), black box attacks generally fall into two further families:
- **Score-based attacks**: the adversary cannot see the model's weights or gradients, but can query it and observe the output probabilities (the confidence scores). Methods such as ZOO (Zeroth Order Optimization) use these repeated queries to numerically estimate the gradient of the loss with respect to the input, and then craft a perturbation from that estimate, without ever needing the true gradient.
- **Decision-based attacks**: the adversary can only observe the final predicted label — no probabilities at all. Techniques like the Boundary Attack start from a large, obviously adversarial perturbation and iteratively shrink it while walking along the decision boundary, using only the model's yes/no answer ("is this still misclassified?") at each step.
Both families trade off query efficiency against attack strength: the less information the attacker can see, the more queries it typically takes to find a good adversarial example, which also makes these attacks easier to detect from unusual query patterns.
## 5.2 White Box Attacks
In a white box setting the adversary has full access to the model — its architecture, its weights, and, critically, its gradients. This is the setting where adversarial perturbations are cheapest to compute, because the attacker can directly ask "in which direction should I nudge each input pixel to increase the loss the most?" and get an exact answer via backpropagation. A few well-known white box attacks:
- **FGSM (Fast Gradient Sign Method)**, introduced by Goodfellow et al. in 2014, is the simplest and fastest of the bunch — a one-step attack (see Section 4) that perturbs every pixel by a fixed amount in the direction of the gradient's sign:
$$ x' = x + \epsilon \cdot \mathrm{sign}\big(\nabla_x L(H(x), y)\big) $$
Here $$\epsilon$$ controls how large the perturbation is allowed to be. Small $$\epsilon$$ keeps the noise imperceptible; large $$\epsilon$$ makes the attack more reliable but easier to spot. We implement this exact attack from scratch in the mini project below.
- **PGD (Projected Gradient Descent)**, proposed by Madry et al. in 2017, is essentially FGSM applied iteratively with a small step size, projecting the result back into an $$\epsilon$$-ball around the original image after every step. It is a multi-step attack, so it is slower than FGSM but far more effective, and is widely used as the standard benchmark for evaluating a model's robustness.
- **JSMA (Jacobian-based Saliency Map Attack)** targets a small number of pixels rather than perturbing the whole image, using the model's Jacobian to find the pixels whose change most increases the probability of the target class.
- **Carlini & Wagner (C&W) attack** formulates the search for an adversarial example as an optimization problem that directly minimizes the size of the perturbation subject to the example being misclassified, and remains one of the strongest attacks against undefended models.
## 5.3 Physical Attacks
One simple way in which the query input is changed from x to x’ is by physically adding something (e.g., a bright color or pattern) to disturb the model. One example is how researchers at CMU added eyeglasses to a person in an attack against facial recognition models. The image below illustrates the attack:
The first row of images corresponds to the original image modified by adding the eyeglasses, and the second row corresponds to the impersonation targets, which are the intended misclassification targets. Just by adding the eyeglasses onto the original image, the facial recognition model was tricked into classifying the images on the top row as the images in the bottom row.
Another example comes from researchers at Google who added stickers to the input image to change the classification of the image, as illustrated by the image below:
These examples show how effective such physical attacks can be.
## 5.4 Out of Distribution (OOD) Attack
Another way in which black box attacks are carried out is through out-of-distribution (OOD) attacks. The traditional assumption in machine learning is that all train and test examples are drawn independently from the same distribution. In an OOD attack, this assumption is exploited by providing images of a different distribution from the training dataset to the model, for example feeding TinyImageNet data into a CIFAR-10 classifier which would lead to an incorrect prediction with high confidence.
# 6. How Can We Trust Machine Learning?
Now that we have taken a look at the various types of adversarial attacks, a natural question then comes — how can we trust our machine learning models if they are so susceptible to adversarial attacks?
One possible approach has been proposed by Chow et al. in 2019 in the paper titled “Denoising and Verification Cross-Layer Ensemble Against Black-box Adversarial Attacks”. The approach is centered around enabling machine learning systems to automatically detect adversarial attacks and then automatically repair them through the use of denoising and verification ensembles.
# 7. Denoising Ensembles
First, input images have to pass through denoising ensembles that attempt different methods to remove any added noise to the image, for example adding Gaussian noise. Since the specific noise added to the image by the adversary is unknown to the defender, there is a need for an ensemble of denoisers to each attempt to remove each type of noise.
The image below shows the training process for the denoising autoencoder — the original image is injected with some noise that the attacker might inject, and the autoencoder tries to reconstruct the original uncorrupted image. In the training process, the objective is to reduce the reconstruction error between the reconstructed image and the original image.
By developing an ensemble of these autoencoders each trained to remove a specific type of noise, the hope is that the corrupted images would be sufficiently denoised such that it is close to the original uncorrupted image to allow for image classification.
## 7.1 Verification Ensemble
After the images have been denoised, they then go through a verification ensemble which reviews every denoised image produced by each denoiser and then classifies the denoised image. Each classifier in the verification ensemble classifies each denoised image, and the ensemble then votes to determine the final category the image belongs to. This means that although some images may not have been denoised the correct way in the denoising step, the verification ensemble votes on all the denoised images, thereby increasing the likelihood of making a more accurate prediction.
## 7.2 Diversity
Diversity of the denoisers and verifiers has been found to be very important. Firstly, because adversarial attackers will keep getting better at altering images, there is a need for a diverse group of denoisers that can handle a variety of corrupted images. Following this, there is also a need for verifiers to be diverse, so they can generate a variety of classifications, making it difficult for adversarial attackers to manipulate them, just as they have managed to manipulate the normal classifiers that we trust and use so frequently in machine learning.
This remains an open problem because, after all these decisions by the various verifiers, there is still a final decision maker that needs to decide whose opinion to listen to. The final decision maker would need to preserve the diversity present in the ensemble, which is not an easy task to tackle.
# 8. Mini Project: Implementing FGSM From Scratch
Reading about adversarial attacks is one thing, watching a model fall for one is another. In this section, we'll implement the Fast Gradient Sign Method (FGSM) from Section 5.2 completely from scratch using only NumPy — no TensorFlow or PyTorch — so every line of the attack is visible with nothing hidden behind a library call.
## 8.1 The Setup
To keep the project runnable on a laptop in a few seconds, we'll train a small multinomial logistic regression classifier (a single linear layer + softmax — essentially a one-layer neural network) on the [scikit-learn `digits` dataset](https://scikit-learn.org/stable/datasets/toy_dataset.html#optical-recognition-of-handwritten-digits-dataset): 1,797 grayscale images of handwritten digits (0–9), each only 8×8 pixels.
```python
import numpy as np
from sklearn.datasets import load_digits
from sklearn.model_selection import train_test_split
np.random.seed(0)
digits = load_digits()
X = digits.data / 16.0 # scale pixel values to [0, 1]
y = digits.target
X_train, X_test, y_train, y_test = train_test_split(
X, y, test_size=0.2, random_state=0
)
n_features = X_train.shape[1] # 64 (8x8 pixels)
n_classes = 10
```
## 8.2 Training the Classifier
Even a linear model is a valid attack target — in fact, a model this simple makes it easy to write out the attack's gradient by hand and check that the implementation matches the math from Section 5.2.
```python
def one_hot(labels, n_classes):
out = np.zeros((len(labels), n_classes))
out[np.arange(len(labels)), labels] = 1
return out
def softmax(z):
z = z - z.max(axis=1, keepdims=True)
exp_z = np.exp(z)
return exp_z / exp_z.sum(axis=1, keepdims=True)
W = np.random.randn(n_features, n_classes) * 0.01
b = np.zeros(n_classes)
Y_train_oh = one_hot(y_train, n_classes)
lr, epochs = 0.1, 300
for epoch in range(epochs):
logits = X_train @ W + b
probs = softmax(logits)
loss = -np.mean(np.sum(Y_train_oh * np.log(probs + 1e-12), axis=1))
grad_logits = (probs - Y_train_oh) / len(X_train)
W -= lr * (X_train.T @ grad_logits)
b -= lr * grad_logits.sum(axis=0)
def predict(x):
return np.argmax(softmax(x @ W + b), axis=1)
clean_acc = np.mean(predict(X_test) == y_test)
print(f"Clean test accuracy: {clean_acc:.4f}")
```
```output
Clean test accuracy: 0.9250
```
92.5% test accuracy on clean, unperturbed digits — good enough to make the point.
## 8.3 The Attack
For a softmax classifier with cross-entropy loss, the gradient of the loss with respect to the input has a clean closed form: it's just the prediction error (predicted probabilities minus the one-hot true label) projected back through the weight matrix. That means we can implement FGSM in three lines, directly mirroring the formula from Section 5.2, $$x' = x + \epsilon \cdot \mathrm{sign}(\nabla_x L)$$:
```python
def fgsm_attack(x, y_true, epsilon):
y_true_oh = one_hot(np.array([y_true]), n_classes)
probs = softmax(x.reshape(1, -1) @ W + b)
grad_logits = probs - y_true_oh # dL / d(logits)
grad_x = grad_logits @ W.T # dL / dx, via the chain rule
x_adv = x + epsilon * np.sign(grad_x).flatten()
return np.clip(x_adv, 0.0, 1.0) # keep valid pixel range
```
Note this is an **untargeted white box attack** in the taxonomy of Sections 2 and 5: we have full access to `W` and `b`, and the only goal is to push the prediction away from the true label, not toward any particular target class.
## 8.4 Watching the Model Fail
Let's run the attack on a handful of test images the model originally classified correctly, using $$\epsilon = 0.15$$:
```python
epsilon = 0.15
for i in range(5):
x, y_true = X_test[i], y_test[i]
x_adv = fgsm_attack(x, y_true, epsilon)
pred_clean = predict(x.reshape(1, -1))[0]
pred_adv = predict(x_adv.reshape(1, -1))[0]
print(f"true={y_true} clean_pred={pred_clean} adversarial_pred={pred_adv}")
```
```output
true=8 clean_pred=8 adversarial_pred=2
true=8 clean_pred=8 adversarial_pred=3
true=5 clean_pred=5 adversarial_pred=2
true=6 clean_pred=6 adversarial_pred=1
true=6 clean_pred=6 adversarial_pred=1
```
Every single one of these digits, correctly classified moments ago, is now confidently wrong. Plotting the clean and adversarial pairs side by side makes it clearer what's going on:
Because these source images are only 8×8 pixels (rather than a high-resolution photo like the panda from Section 1), the added noise is more visible than it would otherwise be. Even so, the digit is still clearly readable to a human on the bottom row, while the model's prediction (in red) has been flipped entirely — exactly the property that makes adversarial examples so dangerous: the input still "looks right" to us, but not to the model.
## 8.5 How Much Damage Does Epsilon Do?
Finally, let's sweep $$\epsilon$$ from 0 (no attack) up to 0.5 and measure test accuracy across the whole test set at each step, to see how quickly a model degrades as the perturbation budget grows:
```python
epsilons = np.linspace(0, 0.5, 11)
accs = []
for eps in epsilons:
X_adv = np.array([fgsm_attack(X_test[i], y_test[i], eps) for i in range(len(X_test))])
accs.append(np.mean(predict(X_adv) == y_test))
```
At $$\epsilon = 0$$ the model performs at its clean 92.5% accuracy, as expected. But by $$\epsilon = 0.15$$ — still a fairly small perturbation — accuracy has already collapsed to under 50%, and by $$\epsilon = 0.3$$ the model is essentially guessing randomly. All of this from a one-line, one-step attack against a model whose gradients we could compute by hand. It's a small-scale demonstration, but the same idea — nudging every pixel in the direction that most increases the loss — is exactly what breaks state-of-the-art convolutional networks in the panda example from Section 1, just with a deeper network and a costlier gradient computation behind it.
The full script (data loading, training, attack, and both plots) is under 100 lines of NumPy and is a good starting point for experimenting further — try a deeper MLP instead of a linear model, implement PGD by looping FGSM with a small step size, or measure how much a simple defense like the denoising ensembles from Section 7 recovers.
# 9. Conclusion
We have taken a look at various types of adversarial attacks, seen one of them fool a real classifier hands-on, and covered a promising method to defend against these attacks. This is definitely something to keep in mind when we implement machine learning models. Instead of blindly trusting the models to produce the correct results, we need to guard against these adversarial attacks and always think twice before we accept the decisions made by these models.
A huge thanks to Professor Liu for this enlightening keynote on this pressing problem in machine learning!
# References
1. [I. J. Goodfellow, J. Shlens, and C. Szegedy, "Explaining and Harnessing Adversarial Examples". arXiv, 2014.](https://arxiv.org/abs/1412.6572)
2. [Tensorflow blog tutorials](https://www.tensorflow.org/tutorials/generative/adversarial_fgsm)
3. [Adverserial Machine Learning](https://en.wikipedia.org/wiki/Adversarial_machine_learning)
4. [Attacking Machine Learning with Adversarial Examples](https://openai.com/blog/adversarial-example-research/)
5. [Breaking neural networks with adversarial attacks](https://towardsdatascience.com/breaking-neural-networks-with-adversarial-attacks-f4290a9a45aa)
6. [A. Madry, A. Makelov, L. Schmidt, D. Tsipras, and A. Vladu, "Towards Deep Learning Models Resistant to Adversarial Attacks". arXiv, 2017.](https://arxiv.org/abs/1706.06083)
7. [scikit-learn: Optical recognition of handwritten digits dataset](https://scikit-learn.org/stable/datasets/toy_dataset.html#optical-recognition-of-handwritten-digits-dataset)
---
# Installing Tensorflow with GPU Support
- URL: https://alinaderiparizi.com/blog/ai/machine-learning/deep-learning/2023/03/19/installing-tensorflow-with-gpu.html
- Date: 2023-03-19
- Kind: Blog post
- Topics: ai, machine-learning, deep-learning
- Summary: The ultimate guide to installing the latest version of TensorFlow on Ubuntu 22.04 with GPU support.
# 1. Introduction
Deep learning's rise to prominence over the past decade has been remarkable. It has come to dominate nearly every major competition, driven several new lines of research, and given rise to new training methods. One of the most popular ways to handle deep learning models and solve complex computational problems is with the help of a deep learning framework.
One of the most popular such libraries is TensorFlow, widely regarded as one of the best tools for tackling almost any problem related to neural networks and deep learning. While it performs well on a CPU for smaller, simpler datasets, its real power comes from running on a Graphics Processing Unit (GPU).
Running on a GPU takes this framework's performance to another level entirely. However, one of the most frustrating parts of working with GPUs in deep learning is dealing with CUDA errors — a headache that most developers, researchers, and enthusiasts run into sooner or later.
In this article, we'll walk through how to install the latest version of TensorFlow with full GPU support.
We'll use Anaconda, since it's one of the best Python environments for machine learning work. To get started, let's install Anaconda on your computer — you can skip this step if you already have it installed on your Ubuntu machine.
# 2. Anaconda
Anaconda is a distribution of the Python and R programming languages for scientific computing (data science, machine learning, large-scale data processing, predictive analytics, and so on) that aims to simplify package management and deployment. The distribution includes data-science packages for Windows, Linux, and macOS, and is developed and maintained by Anaconda, Inc., founded by Peter Wang and Travis Oliphant in 2012. As an Anaconda, Inc. product it's also known as Anaconda Distribution or Anaconda Individual Edition, while the company's paid offerings are Anaconda Team Edition and Anaconda Enterprise Edition. For me, and probably for you and the vast majority of people, the free version does the job just fine.
On Debian-based distros (such as Ubuntu), start by installing a few required system libraries:
```console
$ sudo apt install libgl1-mesa-glx libegl1-mesa libxrandr2 libxrandr2 libxss1 libxcursor1 libxcomposite1 libasound2 libxi6 libxtst6
```
To install Anaconda, visit its official website [anaconda.com](https://www.anaconda.com/products/distribution) and download the latest installer, or run the command below:
```console
$ curl https://repo.anaconda.com/archive/Anaconda3-2022.10-Linux-x86_64.sh | /bin/bash
```
Then follow the installer's prompts to complete the installation. Close and reopen your terminal window for the installation to take effect, or run `source ~/.bashrc` (or `~/.zshrc` if you're using zsh) to refresh the current one.
> **Note**: The installer will ask whether to initialize Anaconda Distribution by running `conda init`. Anaconda recommends answering "yes" — if you answer "no", conda won't modify your shell scripts at all. To initialize later, first run `source [PATH TO CONDA]/bin/activate` and then run `conda init`.
## 2.1 Creating a Conda Environment
Create a new conda environment named `tf` with the following command:
```console
$ conda create --name tf python=3.9
```
You can deactivate and activate it with the following commands:
```console
$ conda deactivate
$ conda activate tf
```
> **Note**: After installing Anaconda, the default conda environment activates automatically whenever you open a new terminal. I personally prefer not to activate it automatically — you can turn this off by running `$ conda config --set auto_activate_base False`.
# 3. Nvidia Driver, CUDA, and cuDNN
You'll need a proper Nvidia driver installed on your machine. If you haven't installed one yet, use the command below:
```console
$ sudo apt install nvidia-driver-515
```
To confirm it's installed properly, run the command below:
```console
$ nvidia-smi
```
```output
Mon Mar 19 12:19:49 2023
+-----------------------------------------------------------------------------+
| NVIDIA-SMI 515.86.01 Driver Version: 515.86.01 CUDA Version: 11.7 |
|-------------------------------+----------------------+----------------------+
| GPU Name Persistence-M| Bus-Id Disp.A | Volatile Uncorr. ECC |
| Fan Temp Perf Pwr:Usage/Cap| Memory-Usage | GPU-Util Compute M. |
| | | MIG M. |
|===============================+======================+======================|
| 0 NVIDIA GeForce ... Off | 00000000:65:00.0 On | N/A |
| 0% 47C P8 44W / 340W | 1325MiB / 10240MiB | 4% Default |
| | | N/A |
+-------------------------------+----------------------+----------------------+
+-----------------------------------------------------------------------------+
| Processes: |
| GPU GI CI PID Type Process name GPU Memory |
| ID ID Usage |
|=============================================================================|
| 0 N/A N/A 1876 G /usr/lib/xorg/Xorg 940MiB |
| 0 N/A N/A 2034 G /usr/bin/gnome-shell 48MiB |
| 0 N/A N/A 3396 G ...1/usr/lib/firefox/firefox 161MiB |
| 0 N/A N/A 4658 G ...816051303568945556,131072 42MiB |
| 0 N/A N/A 4797 G ...RendererForSitePerProcess 130MiB |
+-----------------------------------------------------------------------------+
```
Now install CUDA and cuDNN:
```console
(tf) $ conda install -c conda-forge cudatoolkit=11.2.2 cudnn=8.1.0
```
Next, configure the system paths. You'll need to run the following command every time you start a new terminal, after activating your conda environment:
```console
(tf) $ export LD_LIBRARY_PATH=$LD_LIBRARY_PATH:$CONDA_PREFIX/lib/
```
For convenience, it's recommended that you automate this instead, so the paths are configured automatically whenever you activate the environment:
```console
(tf) $ mkdir -p $CONDA_PREFIX/etc/conda/activate.d
(tf) $ echo 'export LD_LIBRARY_PATH=$LD_LIBRARY_PATH:$CONDA_PREFIX/lib/' > $CONDA_PREFIX/etc/conda/activate.d/env_vars.sh
```
On Ubuntu 22.04, you'll also need to install NVCC:
```console
# Install NVCC
(tf) $ conda install -c nvidia cuda-nvcc=11.3.58
# Configure the XLA cuda directory
(tf) $ mkdir -p $CONDA_PREFIX/etc/conda/activate.d
(tf) $ printf 'export LD_LIBRARY_PATH=$LD_LIBRARY_PATH:$CONDA_PREFIX/lib/\nexport XLA_FLAGS=--xla_gpu_cuda_data_dir=$CONDA_PREFIX/lib/\n' > $CONDA_PREFIX/etc/conda/activate.d/env_vars.sh
(tf) $ source $CONDA_PREFIX/etc/conda/activate.d/env_vars.sh
# Copy libdevice file to the required path
(tf) $ mkdir -p $CONDA_PREFIX/lib/nvvm/libdevice
(tf) $ cp $CONDA_PREFIX/lib/libdevice.10.bc $CONDA_PREFIX/lib/nvvm/libdevice/
```
# 4. Installing TensorFlow
TensorFlow requires a recent version of pip, so upgrade pip first before installing TensorFlow itself:
```console
(tf) $ pip install --upgrade pip
(tf) $ pip install tensorflow
```
Now verify the GPU setup:
```console
(tf) $ python3 -c "import tensorflow as tf; print(tf.config.list_physical_devices('GPU'))"
```
If a list of GPU devices is returned, TensorFlow has been installed successfully with GPU support.
```output
[PhysicalDevice(name='/physical_device:GPU:0', device_type='GPU')]
```
# References
- [*Installing Anaconda (anaconda.com)*](https://docs.anaconda.com/anaconda/install/index.html)
- [*Install TensorFlow with pip (tensorflow.org)*](https://www.tensorflow.org/install/pip)
---
# Game Hacking, Part 2: khiar-ware, an External CS:GO Cheat
- URL: https://alinaderiparizi.com/project/security/cracking/game-hacking/2022/10/16/game-hacking-2-khiar-ware.html
- Date: 2022-10-16
- Kind: Project
- Topics: security, cracking, game-hacking
- Code: https://github.com/mralinp/khiar-ware
- Summary: A report on khiar-ware — an external CS:GO cheat: reading and writing csgo.exe's memory from a separate process, keeping offsets in sync with the game, and why kernel-mode anti-cheat is the technique's actual ceiling.
[khiar-ware](https://github.com/mralinp/khiar-ware) is a small Windows cheat for CS:GO I built to put [Part 1](https://alinaderiparizi.com/project/security/cracking/game-hacking/2022/10/09/game-hacking-1-fundamentals.html)'s concepts into working code: WallHack, TriggerBot, RadarHack, and AutoBhop, all from a single external C++ process. It's GPL-3.0, it's a few years old at this point, and its offsets are almost certainly stale against the current game — CS:GO itself was superseded by CS2 in 2023, and Source-engine `client.dll` offsets don't survive an engine migration. It stands as a working reference for the techniques, not a tool for touching a live match.
**Educational purposes only.** Using anything like this on a VAC-secured server risks a permanent ban, and cheating against real opponents is exactly the kind of thing that makes online games worse for everyone else. Testing shown here was done entirely offline, in CS:GO's own `aim_botz` bot-practice map, with the game launched in `-insecure` mode — which disables VAC and, as a direct consequence, also blocks you from joining any VAC-secured server at all. That's not a workaround; it's the point.
khiar-ware's glow-based wallhack and radar running against bots in aim_botz, tested with VAC disabled via -insecure.
# 1. Shape of the thing
Per Part 1's terms, khiar-ware is an **external** cheat: it's its own console executable, not a DLL injected into `csgo.exe`. `main()` prints a banner, sets up the four feature classes, and then runs a plain polling loop — call each feature's `refresh()`, check for a hotkey, sleep one millisecond, repeat:
```cpp
while (true) {
glow.refresh();
radar.refresh();
bhop.refresh();
trigger.refresh();
int key = get_key();
// INSERT toggles glow, HOME toggles the triggerbot, PAGE UP toggles bhop
...
Sleep(1);
}
```
Every feature is independent, toggled at runtime, and reads/writes the target process through one shared object — everything funnels through a single `MemoryManager`. (There's also a fifth class in the repo, `ScriptBot`, that's never instantiated in `main()` at all — dead code from an earlier idea, left in place. It's a decent reminder that a project's actual feature set is what's wired up, not everything sitting in the source tree.)
# 2. Talking to csgo.exe
`MemoryManager` does exactly the two things Part 1 said an external cheat needs: find the target process, and give every feature a typed way to read and write it.
Finding the process and its modules is standard Windows tool-help API [2] — enumerate running processes for `csgo.exe`, `OpenProcess` [3] on it, then walk its loaded modules with `CreateToolhelp32Snapshot` [2] to find `client.dll` and `engine.dll` and record their base addresses. That base address is the "today's starting point" from Part 1's section 6 — every feature's memory access is that base plus a fixed offset.
Reading and writing themselves are two small template functions wrapping `ReadProcessMemory`/`WriteProcessMemory` [4, 5], so the rest of the codebase can write `mem->read(address)` or `mem->write(address, 6)` instead of juggling raw byte buffers everywhere:
```cpp
template
auto read(DWORD dwAddress) {
type buff{};
ReadProcessMemory(this->_hproc, (LPVOID)dwAddress, &buff, sizeof(type), NULL);
return buff;
}
template
BOOL write(DWORD dwAddress, type ValueToWrite) {
return WriteProcessMemory(this->_hproc, (LPVOID)dwAddress, &ValueToWrite, sizeof(type), NULL);
}
```
Every feature below is built entirely out of calls to these two functions at specific offsets. There's no hooking, no injected code, no rendering takeover — just reading and occasionally writing plain memory from outside the process.
# 3. Offsets that update themselves
`Offsets.h` holds two lists of named constants — `signitures` (module-relative addresses like `dwLocalPlayer`, `dwEntityList`, `dwGlowObjectManager`, `dwForceJump`) and `netvars` (offsets *within* a player entity, like `m_iHealth`, `m_vecOrigin`, `m_iTeamNum`, `m_iCrosshairId`, `m_bSpotted`) — around eighty names in total between the two.
None of them are hand-derived. `updater.py` regenerates the whole file from [hazedumper](https://github.com/frk1/hazedumper) [1], a community-maintained CS:GO offset dump that did the actual signature-scanning work Part 1 described:
```python
url = 'https://raw.githubusercontent.com/frk1/hazedumper/master/csgo.json'
r = requests.get(url, allow_redirects=True)
# ...parse csgo.json's "signatures" and "netvars" objects,
# write each one out as a `const DWORD` into Offsets.h
```
That's the practical answer to Part 1's maintenance problem: rather than re-deriving offsets by hand after every game patch, regenerate the header from an external dump and rebuild. It also means khiar-ware's own currency is entirely tied to hazedumper's — once a public dumper for a game goes unmaintained, so does everything built on top of it, which is a big part of why this particular project is stale today.
# 4. The four features
**SimpleGlow (WallHack).** The interesting choice here is that it doesn't draw anything at all. CS:GO's engine already has a glow-rendering system (used for the legitimate "outline teammates through walls" setting), backed by an array of glow structs — one per glowable entity, holding color, alpha, and a couple of render flags including `m_bRenderWhenOccluded`. Every refresh, `SimpleGlow` walks the entity list, and for every living, non-dormant entity on the opposing team, reads that entity's glow struct, sets its color from a red-to-green ramp based on current health, flips `m_bRenderWhenOccluded` on, and writes the whole struct back:
```cpp
gst = mem->read(glowObj + (glowIdx * 0x38));
gst.G = health * 0.01f;
gst.R = health * -0.01f + 1.0f;
gst.m_bRenderWhenOccluded = true;
mem->write(glowObj + (glowIdx * 0x38), gst);
```
One struct write per enemy per frame, and the game's own renderer does the rest — no overlay window, no drawing code of its own.
**TriggerBot.** While Alt is held, it reads the local player's `m_iCrosshairId` netvar — the engine's own record of which entity index is currently under the crosshair — and if that entity exists and isn't on the local player's team, fires: a short randomized delay, a `mouse_event(MOUSEEVENTF_LEFTDOWN)`, another short delay, then `LEFTUP`. Because it's external, it can't call the game's "fire" function directly the way an internal hook could — it has to go through the same OS-level input simulation any input-automation tool uses, which is also why it needs the crosshair check at all: it has no way to fire *at* a target, only to fire *when* the game says one is already under the crosshair.
**AutoBhop.** The smallest feature by far: while Space is held and the local player's `m_fFlags` netvar has the on-ground bit set, it writes a nonzero value to `dwForceJump` — a single engine-global address the game's own movement code checks each tick to decide whether to force a jump regardless of normal input timing. No aiming, no entity list, one conditional memory write.
**Radar.** This one turns out to use the exact same trick as SimpleGlow, and I described it wrong to myself when I first sketched this post — it doesn't draw a custom overlay at all. CS:GO already tracks a per-entity `m_bSpotted` netvar, which the game's own built-in radar/minimap UI uses to decide who to show: normally it's only true for an enemy your team has actually spotted. `Radar::refresh()` just walks up to 32 entity slots and force-writes `m_bSpotted = true` on every non-dormant one, every frame:
```cpp
for (int i = 0; i < 32; i++) {
DWORD entity = getEntity(i);
if (entity != NULL && isDormant(entity) == false) {
mem->write(entity + netvars::m_bSpotted, true);
}
}
```
One boolean write per entity, and the game's existing minimap shows everyone. Between this and SimpleGlow, two of khiar-ware's four features work by flipping a flag the engine already checks for a legitimate purpose, rather than building any rendering of their own — which in hindsight is the most reusable idea in the whole project: before writing an overlay, check whether the game already has a rendering path you can just redirect.
# 5. Testing without risking the account
The setup section of the repo's README is worth taking seriously on its own, because it's the difference between "testing" and "guaranteed ban." CS:GO's Steam launch options accept `-insecure`, which explicitly disables VAC for that session — and, as a direct trade-off, blocks the client from joining any VAC-secured server at all. That combination is exactly what makes it useful for this kind of work: there's no server to accidentally cheat against, and no anti-cheat process running to trip. The screenshot above is `aim_botz`, a community-made offline practice map full of stationary and moving bots, played entirely locally — a reasonable place to see whether a memory offset is even correct before it matters at all whether anyone's watching.
# 6. Ring 0: the ceiling this technique runs into
Everything above — and everything in Part 1 — lives entirely in what Part 1 called usermode: khiar-ware, `csgo.exe`, and even a hypothetical kernel-unaware anti-cheat process all run at the CPU's **Ring 3**, the least-privileged of the protection rings x86 defines (Rings 1 and 2 exist in the architecture but neither Windows nor Linux actually use them; in practice it's a two-tier system, Ring 3 for applications and **Ring 0** for the OS kernel and its drivers). The asymmetry between the two rings is total: Ring 0 code can inspect and modify *any* process's memory, including another Ring 0 driver's, with no permission check standing in its way, because it *is* the thing that would normally enforce that check. Ring 3 code — no matter how privileged the user account running it — has no equivalent visibility into Ring 0 at all.
That asymmetry is the entire reason kernel-mode anti-cheat exists, and it's worth being honest about what it means for everything in this post: a driver running at Ring 0 can directly watch every `OpenProcess` call made against the protected game, from any process, with any requested access rights — which is precisely the API khiar-ware's `MemoryManager` calls to get started. It doesn't need to catch khiar-ware's specific offsets or behavior; the act of opening a handle to `csgo.exe` with memory-read access from an unrelated process is itself the tell. FACEIT's own documentation describes exactly this shape: their Anti-Cheat is a usermode app plus a kernel-mode driver loaded at boot, and more recently a Secure Boot and TPM 2.0 requirement on top of that [5]. EAC, BattlEye, and Riot's Vanguard are built the same way, for the same reason [6, 7]. None of khiar-ware's techniques would survive first contact with any of them, and that's true independent of whether its offsets happen to be current.
So — purely as an idea, because "how do you actually reach Ring 0" is a real technique with real consequences and not this post's subject — what does having Ring 0 yourself change? A few concrete things, at a conceptual level:
- **You stop using the APIs the anti-cheat is watching.** Reading and writing memory from kernel mode uses different, kernel-internal mechanisms (for instance `MmCopyVirtualMemory`) rather than `ReadProcessMemory`/`OpenProcess`, so the specific usermode calls a Ring 3-only detector watches for simply never happen.
- **You can hide your own existence from anything enumerating the normal way.** This is usually called DKOM — Direct Kernel Object Manipulation — and it means editing the kernel's own bookkeeping structures directly: for instance, unlinking your driver or process from the linked list the kernel walks to answer "what's running right now," so a query that lists processes the standard way never sees you, even though you're still executing.
- **You're now visible to, and in a fair fight with, anything else at Ring 0** — which very much includes the anti-cheat's own driver, if it's also kernel-mode. Reaching Ring 0 isn't reaching a blind spot; it's reaching the same floor the anti-cheat is standing on, which is exactly why kernel anti-cheats spend so much of their effort watching *that* layer specifically rather than assuming it's safe by default [6].
There are, publicly and broadly, two routes into Ring 0 on modern Windows, and both are extensively written about rather than secret: writing your own kernel driver and getting it loaded, which is deliberately hard, because Windows requires kernel-mode drivers to carry a valid digital signature before the loader will run them at all [8]; or **BYOVD** — Bring Your Own Vulnerable Driver — where instead of writing new kernel code, you load an *already*-signed, legitimately trusted third-party driver that happens to have a bug (commonly, an IOCTL handler that will read or write arbitrary physical or kernel memory on request, with no check on who's asking), and drive that existing bug from usermode to get de-facto kernel read/write without ever authoring or signing a driver of your own [9, 10]. This is exactly serious enough a problem that there's a dedicated public catalog, [LOLDrivers](https://www.loldrivers.io) [11], tracking known-vulnerable signed drivers specifically so defenders — including anti-cheat vendors — can detect and block them; the arms race here runs in both directions, in public, on both sides.
The takeaways, stripped of everything else in this section:
- Ring 3 is always visible to Ring 0; the reverse is never true. That single fact is the entire justification for kernel-mode anti-cheat existing at all.
- Anything crossing the user/kernel boundary through a documented API — `OpenProcess`, `ReadProcessMemory`, `CreateRemoteThread` — is exactly what a kernel-mode anti-cheat driver is positioned to observe directly, regardless of how well the usermode side is written.
- Reaching Ring 0 yourself, by any route, doesn't grant invisibility — it grants a fair fight, on the same floor the anti-cheat already occupies.
- None of these techniques are secret on either side. BYOVD, DKOM, and driver-signature enforcement are all publicly documented specifically *because* defenders need to know them too — which is a decent one-sentence summary of why this whole field keeps moving.
# 7. What building it actually taught
The instructive part, in hindsight, wasn't any single feature — it was how differently each one reached the same goal, and how two of the four turned out to need no rendering code at all once I looked closely enough at what the engine already tracked. None of it would survive a client that re-randomized its own internal layout on every build, encrypted these structures, or moved this state server-side entirely — and, as section 6 lays out, modern anti-cheat has, in various ways, done exactly that, one ring up from everything khiar-ware does. It's a genuinely well-matched arms race, and building even a small, dated external cheat like this one is a reasonable way to feel out why.
# References
1. F. (frk1). hazedumper. GitHub. [github.com/frk1/hazedumper](https://github.com/frk1/hazedumper)
2. Microsoft. CreateToolhelp32Snapshot function. Microsoft Learn. [learn.microsoft.com/.../nf-tlhelp32-createtoolhelp32snapshot](https://learn.microsoft.com/en-us/windows/win32/api/tlhelp32/nf-tlhelp32-createtoolhelp32snapshot)
3. Microsoft. OpenProcess function. Microsoft Learn. [learn.microsoft.com/.../nf-processthreadsapi-openprocess](https://learn.microsoft.com/en-us/windows/win32/api/processthreadsapi/nf-processthreadsapi-openprocess)
4. Microsoft. ReadProcessMemory function. Microsoft Learn. [learn.microsoft.com/.../nf-memoryapi-readprocessmemory](https://learn.microsoft.com/en-us/windows/win32/api/memoryapi/nf-memoryapi-readprocessmemory)
5. FACEIT. What is FACEIT Anti-cheat and how does it work? FACEIT Support. [support.faceit.com](https://support.faceit.com/hc/en-us/articles/9394666828188-What-is-FACEIT-Anti-cheat-and-how-does-it-work)
6. C. Dorner, L. D. Klausner. If It Looks Like a Rootkit and Deceives Like a Rootkit: A Critical Examination of Kernel-Level Anti-Cheat Systems. arXiv:2408.00500, 2024. [arxiv.org/abs/2408.00500](https://arxiv.org/abs/2408.00500)
7. s4dbrd. How Kernel Anti-Cheats Work: A Deep Dive into Modern Game Protection. 2026. [s4dbrd.github.io](https://s4dbrd.github.io/posts/how-kernel-anti-cheats-work/)
8. Microsoft. Driver Signing With Digital Signatures. Microsoft Learn. [learn.microsoft.com/.../driver-signing](https://learn.microsoft.com/en-us/windows-hardware/drivers/install/driver-signing)
9. Bitdefender. What is Bring Your Own Vulnerable Driver (BYOVD). Bitdefender TechZone. [techzone.bitdefender.com](https://techzone.bitdefender.com/en/tech-explainers/what-is-bring-your-own-vulnerable-driver--byovd-.html)
10. Picus Security. What Is a BYOVD Attack? Bring Your Own Vulnerable Driver, Explained. [picussecurity.com](https://www.picussecurity.com/resource/blog/what-are-bring-your-own-vulnerable-driver-byovd-attacks)
11. LOLDrivers. [loldrivers.io](https://www.loldrivers.io)
---
# Game Hacking, Part 1: Anti-Cheats, Engines, and How Cheats Actually Work
- URL: https://alinaderiparizi.com/project/security/cracking/game-hacking/2022/10/09/game-hacking-1-fundamentals.html
- Date: 2022-10-09
- Kind: Project
- Topics: security, cracking, game-hacking
- Summary: Anti-cheat, game engines, internal vs. external cheats, injection, and memory reading and writing — the concepts behind every game cheat, before we build one.
This is the first of two posts. This one is background: the concepts behind how game cheats and anti-cheats actually work. The second is a report on [khiar-ware](https://github.com/mralinp/khiar-ware), a CS:GO cheat I built to learn this material hands-on.
**This project and these posts are for educational purposes only**, to understand game security from the offense side — the same way people study exploit development to understand defense. Cheating in an online game against real opponents ruins the game for them and gets accounts banned (Valve's VAC, in particular, does not forgive). Everything demonstrated in the next post was run offline, against bots, with the game's anti-cheat explicitly disabled for testing. If you build on this, do the same.
# 1. What a cheat actually needs
Strip away the specifics of any given game, and a cheat needs exactly two things: **information** the game has and isn't showing you (where the enemies are, whether they're behind a wall, how much ammo they have), and **influence** over what happens next (aim precisely, fire exactly on target, jump at the perfect frame). Nearly everything that gets called a "cheat" is one or both of those: an ESP/wallhack is pure information — read the enemy's position and draw it, or make the game itself render it through walls. An aimbot or triggerbot is information plus influence — read where an enemy is, then move the mouse or fire a shot for you. A speedhack or bunnyhop bot is closer to pure influence — nudge a value or a timed input the game wasn't expecting.
Both of those — information and influence — come from the same place: the game process's memory. A running game is, from the operating system's point of view, just a process with a big chunk of memory holding the current state of the world: player positions, health, view angles, weapon state. If you can read that memory, you have information. If you can write to it, or feed the game inputs at the right moment, you have influence.
# 2. What a game engine keeps in memory (roughly)
You don't need the source code to guess the shape of what's in there, because most game engines solve the same problem the same way. There's typically an **entity list** — an array or table of every object in the current scene, players and bots included, each with a class identifying what it is. Each entity has fields for the things you'd expect: position, view angles, health, team, current weapon, animation state. There's usually a single pointer somewhere to "the local player" — you, specifically, distinguished from everyone else because the client needs to know whose input to read and whose camera to render from.
For a first-person multiplayer game specifically, there's also a client-server split to know about: the server is authoritative over what actually happened, but the client predicts and interpolates so the game feels responsive despite network latency, and receives corrections when its prediction was wrong. That matters for cheating in one specific way — anything you fake purely on the client (a position, a hitbox) can be overruled or flagged by the server the moment it disagrees strongly enough with what the server itself is tracking. That's part of *why* certain cheats (aim precision, extra information) are harder for a server to catch than others (speed, teleportation): the server already has strong opinions about speed and position, and weaker ones about where you chose to aim.
# 3. How anti-cheat actually catches things
It's worth being concrete about this, because "anti-cheat" isn't one mechanism — it's several, usually layered:
- **Signature scanning.** The anti-cheat has a library of known cheats' code, byte patterns, or file hashes, and periodically scans the game's own process memory and loaded modules for a match. This catches popular, unmodified public cheats extremely well and custom, never-distributed ones almost not at all — there's nothing to match a signature against.
- **Integrity checking.** The anti-cheat hashes or otherwise verifies chunks of the game's own code and critical data structures at intervals, so that a hook (redirecting a function to run your code first) or a patched instruction shows up as a mismatch against what should be there.
- **Behavioral / statistical analysis.** Rather than looking for cheat code at all, this looks at what the player *did*: aim that snaps onto targets with inhuman consistency, reaction times below what any human demonstrably achieves, trigger timing that's suspiciously exact. This is the hardest category to build (a great player is also an outlier) and the hardest for a cheat to fully hide from, because it doesn't care how the advantage was obtained.
- **Delayed, server-side, wave-ban systems.** Valve's VAC is the canonical example: it doesn't act in real time. Suspected violations are queued and reviewed, then bans go out in batches, sometimes weeks later, deliberately so that a cheat developer can't immediately correlate "I changed X" with "I got banned" and patch around the specific trigger.
- **Kernel-mode monitoring.** The heaviest tier: rather than watching from inside the game's own process (usermode, same privilege level as the game and any external cheat reading it), the anti-cheat loads its own driver into the OS kernel, which can see essentially everything happening on the machine, at a privilege level no ordinary cheat process runs at. This is what modern anti-cheats like FACEIT AC, EAC, BattlEye, and Vanguard actually do, and it's significant enough that Part 2 of this series gives it its own section.
Most real anti-cheat deployments run several of these at once specifically because each one has different blind spots, and a technique that defeats one usually does nothing against the others.
# 4. Internal vs. external
Once you know what you want to read or change, there are two fundamentally different ways to reach it.
An **internal** cheat runs *inside* the game's own process — typically a DLL that gets loaded or injected into it. Once your code is running in that address space, reading and writing the game's memory is just reading and writing your own memory: no special permissions, no cross-process API calls, and — because you're in-process — you can hook the game's own functions directly (intercept its rendering calls to draw your own overlay through the game's own renderer, intercept its input handling, even call the game's own internal functions instead of reimplementing them). That last point matters more than it sounds: an internal aimbot can call the engine's own "set view angle" function directly, producing movement indistinguishable in principle from a real mouse turn, where an external one has to fake a mouse turn from outside and hope it looks the same. The cost is exposure: your code is now literally part of the process an anti-cheat is scanning, so it has to actively evade being noticed — unusual loaded modules, hooked functions, suspicious memory regions.
An **external** cheat runs as a *separate* process and reaches into the game's memory from outside, through operating-system APIs meant for exactly this (debuggers use the same calls). Nothing of yours ever executes inside the game's process, which sidesteps a whole category of in-process detection. The cost is capability: you can't hook the game's own rendering to draw through it, so anything you want to *see* — a radar, ESP boxes — needs its own overlay window layered on top, or has to be smuggled through a rendering mechanism the game already has (more on that trick specifically in Part 2). Anything you want to *do* beyond reading and writing raw values has to be done from outside too — simulating mouse and keyboard input, rather than calling the game's own "fire weapon" function directly.
Neither is strictly safer in general — it depends entirely on what the specific anti-cheat is watching for — but they're a genuinely different engineering problem, and it's worth deciding which one you're building before writing any code.
# 5. Injection: getting code into someone else's process
Injection is specifically the internal cheat's problem: how do you get your DLL loaded into a process you didn't start? The classic technique is almost boringly simple once you see it: `OpenProcess` to get a handle to the target, `VirtualAllocEx` to reserve some memory inside it, `WriteProcessMemory` to copy the path of your DLL into that memory, then `CreateRemoteThread` pointed at `LoadLibraryA` with that path as its argument. You've just made the target process call its own `LoadLibrary` on your DLL, from a thread you created, as if it had asked to load it itself — and Windows dutifully runs your `DllMain` inside their address space.
That specific sequence is also extremely well known, which is exactly why more evasive techniques exist. **Manual mapping** is the main one: instead of asking the loader to do the work, you do the loader's job yourself, from your injector process — parse your DLL's PE headers, allocate memory in the target for its sections, copy each section to its correct relative address, walk the import table and resolve every function your DLL calls against the target's already-loaded modules, apply base relocations if the memory didn't land at the DLL's preferred address, and finally call the entry point manually. It's considerably more code than the four-API-call version above, but the payoff is specific: because you never called `LoadLibrary`, your DLL never gets added to the target's module list, and any check that walks that list looking for unrecognized modules — which is a very common, very cheap first-line check — simply doesn't see it.
I'm not going to walk through manual mapping's implementation line by line here; the point isn't the recipe, it's understanding that "injection" is really just "make the target process do something it normally does — load and run some code — but on your behalf," and every detection method is really a way of noticing that something caused that to happen unexpectedly.
# 6. Reading and writing memory, for real
For an external cheat this is the entire toolkit, and it's a small one. `OpenProcess` gets you a `HANDLE` to the target, gated by exactly the access rights you request and the OS's own permission checks (you can't touch a process you don't have rights to, admin or not, if it's sufficiently protected). `ReadProcessMemory` and `WriteProcessMemory` then do exactly what they say, given that handle, an address, and a size — they're the same primitives a debugger uses to let you inspect a program you're stepping through.
The catch is that "an address" isn't something you know in advance. A game restarts with its memory laid out differently every time — address space layout randomization sees to that at the module level, and the loader picks its own base address for the executable and its DLLs on each run. What *is* stable, module-restart to module-restart, is the **offset** from a module's base address to a piece of data you care about, and the offset from the start of an object (a player entity, say) to one of its fields — because the compiler laid those out the same way every time it built that version of the game. So the actual workflow is: find the game process, find the base address of the module you care about right now (`client.dll` typically holds the interesting state in a Source-engine game), and add a previously-discovered offset to get today's real address. Those offsets have two flavors in most cheat codebases: ones relative to a module's base (often called **signatures**, because they're originally found by scanning the module's bytes for a unique instruction pattern) and ones relative to an object instance's own start (often called **netvars**, because in Source-engine games specifically they frequently match names the engine's own networking code uses internally, like `m_iHealth` or `m_vecOrigin`).
Very often you need to chase more than one offset in sequence — read a pointer at `base + offset_a` to get some manager object's address, then read again at `that_address + offset_b` to get the actual value you want. That's a **pointer chain**, and it's the norm rather than the exception: an entity list is usually a pointer to an array of pointers, so getting to a specific player's health is typically "read the entity-list pointer, read the pointer at that player's slot, then read the health field at a fixed offset from that entity's own address" — three memory operations for one number, every single refresh.
Every time the game updates, the compiler can lay memory out differently, and every offset can silently go stale — which is the single biggest maintenance burden in this whole exercise, and it's why offset lists are usually generated by a separate scanning tool rather than typed in by hand once and left alone.
# 7. The toolbox
A short list of what actually gets used, beyond a C or C++ compiler and the Windows API headers:
- **Cheat Engine** — a memory scanner built exactly for this: point it at a running process, search for a value (your health, say), change the value in-game, search again for what changed, and repeat until one address is left. It's the fastest way to find a single offset by hand without touching a disassembler.
- **A disassembler/decompiler** (IDA, Ghidra, x64dbg) — for finding *why* an address holds what it holds, following a function to understand a data structure's layout, or writing the byte-pattern signature that finds a given piece of code reliably across game versions.
- **A DLL injector** — for internal cheats, a small utility implementing the injection sequence from section 5 (or a manual mapper), so you're not rewriting it into every project.
- **An immediate-mode UI library, usually Dear ImGui** — the standard choice for cheat overlays specifically because it can be hooked into an existing renderer's present/frame call with very little glue code, which suits an internal cheat's "draw through the game's own renderer" approach well.
- **Public offset dumpers** — community-maintained tools and repositories that do the signature-scanning work in section 6 continuously, so individual projects can pull a fresh, current offset list instead of re-deriving it after every game patch.
# 8. Where people actually learn this
Almost none of the above is secret, and almost none of it was worked out from scratch by me — it's a small, well-documented field with an active community and a genuine on-ramp for beginners:
- **[UnknownCheats](https://www.unknowncheats.me)** is the oldest and largest forum for this specifically. It's organized by game, with entire sub-forums of source-available cheats, offset dumps kept current by the community, and long-running technical threads on injection, hooking, and anti-cheat internals — genuinely the first place to search when a specific game or technique is stuck.
- **[Guided Hacking](https://guidedhacking.com)** is the more structured alternative: a forum plus a large library of tutorials (many free, some paid) that walk through exactly the fundamentals in this post — injection, pattern scanning, hooking — as sequential lessons rather than scattered threads, which makes it a better starting point if you've never done any of this before.
- **Nick Cano's *Game Hacking: Developing Autonomous Bots for Online Games*** (No Starch Press, 2016) [1] is the closest thing this field has to a textbook — it covers pattern scanning, code injection, DLL and code caves, and building an actual bot end to end, in book form rather than forum-thread form.
That last community reference is exactly where khiar-ware's own offset supply comes from, which is where the next post picks up: khiar-ware doesn't do its own signature scanning at all — it pulls a community-maintained offset dump on demand, and the interesting engineering is entirely in what it does with those offsets afterward.
# References
1. N. Cano. *Game Hacking: Developing Autonomous Bots for Online Games.* No Starch Press, 2016. [nostarch.com/gamehacking](https://nostarch.com/gamehacking)
2. Microsoft. ReadProcessMemory function. Microsoft Learn. [learn.microsoft.com/.../nf-memoryapi-readprocessmemory](https://learn.microsoft.com/en-us/windows/win32/api/memoryapi/nf-memoryapi-readprocessmemory)
3. Microsoft. WriteProcessMemory function. Microsoft Learn. [learn.microsoft.com/.../nf-memoryapi-writeprocessmemory](https://learn.microsoft.com/en-us/windows/win32/api/memoryapi/nf-memoryapi-writeprocessmemory)
4. Microsoft. CreateRemoteThread function. Microsoft Learn. [learn.microsoft.com/.../nf-processthreadsapi-createremotethread](https://learn.microsoft.com/en-us/windows/win32/api/processthreadsapi/nf-processthreadsapi-createremotethread)
5. Microsoft. LoadLibraryA function. Microsoft Learn. [learn.microsoft.com/.../nf-libloaderapi-loadlibrarya](https://learn.microsoft.com/en-us/windows/win32/api/libloaderapi/nf-libloaderapi-loadlibrarya)
6. UnknownCheats. [unknowncheats.me](https://www.unknowncheats.me)
7. Guided Hacking. [guidedhacking.com](https://guidedhacking.com)
---
# What is an AutoEncoder?
- URL: https://alinaderiparizi.com/blog/ai/machine-learning/deep-learning/2022/09/16/auto-encoder.html
- Date: 2022-09-16
- Kind: Blog post
- Topics: ai, machine-learning, deep-learning
- Summary: One of the most popular deep architectures is the variety of AutoEncoders. This article is a straightforward walkthrough to get familiar with AutoEncoders.
# 1. Intro
An autoencoder is an unsupervised artificial neural network that learns to compress and encode data efficiently, then learns to reconstruct that data from the reduced, encoded representation into something as close to the original input as possible.
By design, an autoencoder reduces the dimensionality of data by learning to ignore the noise in it.
Here is an example of an input/output pair from the MNIST dataset passed through an autoencoder.
a simple AutoEncoder
## 1.1 AutoEncoder Components
An autoencoder consists of four main parts:
1. **Encoder**: learns how to reduce the input's dimensionality and compress it into an encoded representation.
2. **Bottleneck**: the layer that holds the compressed representation of the input data. This is the lowest-dimensional representation the network produces.
3. **Decoder**: learns how to reconstruct the data from the encoded representation, aiming to get as close to the original input as possible.
4. **Reconstruction Loss**: the metric that measures how well the decoder is performing, i.e. how close the output is to the original input.
Training then uses backpropagation to minimize the network's reconstruction loss. At this point you're probably wondering why you'd train a neural network just to reproduce its own input. This article walks through the most common use cases for autoencoders. Let's get started:
$$ Loss = \lVert X - \hat{X} \rVert_{2}^{2} $$
## 1.2 Problem Statement
The network architecture for an autoencoder can vary — a simple feedforward network, an LSTM, or a convolutional neural network — depending on the use case. This article uses a CNN to solve a simple problem: removing an intrusive piece of text from a picture. You've probably noticed that many photography websites and photographers stamp a signature or watermark onto their images, which keeps other people from lifting their photos, paintings, and other artwork without credit.
For example, here's a sample photo taken by my psychologist friend Reza Parizi ([reza__parizi](https://www.instagram.com/reza__parizi/)):
We can treat this kind of text — commonly known as a [**watermark**](https://en.wikipedia.org/wiki/Watermark) — as static noise added to the picture, and look for a filter (or set of filters) that removes it. Denoising is one of the main use cases for autoencoders, so let's put one to work on this problem.
# 2. Preparing the Data
As with any deep learning model, the first thing we need is data. For this problem I used the popular [**Stanford Cars**](https://ai.stanford.edu/~jkrause/cars/car_dataset.html) dataset and stamped the static text "Hot-Tube" onto each image as a synthetic watermark. Say the dataset lives in a directory named `datasets/car`, with the training images inside a subdirectory called `train`. First, we import the required modules:
```python
import tensorflow as tf
import numpy as np
import keras
import keras.layers
import os
import matplotlib.pyplot as plt
import cv2
```
Next, we load the dataset:
```python
path_to_train_imgs = './datasets/cars/train'
train_imgs_list = os.listdir(path_to_train_imgs)
train_imgs_list = [f"{path_to_train_imgs}/{path}" for path in train_imgs_list]
```
These are the original, unmodified images, which we'll treat as ground truth. To generate the corresponding inputs, we have two options:
1. Load all the data into memory up front and loop over it, adding the watermark text to each image.
2. Write a `DataGenerator` that adds the watermark to each image on the fly, while assembling a batch.
The first approach isn't a great option, especially with images: image datasets tend to be large, and loading that much data into memory at once risks running out of memory and crashing the program.
A data generator instead loads only the slice of data needed for the current batch, which avoids that problem entirely. With that motivation out of the way, let's write one for our use case.
```python
class DataGenerator(keras.utils.Sequence):
def __init__(self, image_list, batch_size=16, shuffle=True):
self.image_list = image_list
self.batch_size = batch_size
self.shuffle = shuffle
self.on_epoch_end()
def load_img(self, path: str) -> np:
img = cv2.imread(path)
img = cv2.cvtColor(img, cv2.COLOR_BGR2RGB)
img = cv2.resize(img, (256,256))
return img
def on_epoch_end(self):
self.indexes = np.arange(len(self.image_list))
if self.shuffle == True:
np.random.shuffle(self.indexes)
def __len__(self):
return len(self.image_list)//self.batch_size
def add_text(self, img: np) -> np:
return cv2.putText(img=img, text='Hot-Tube', org=(46, 128), fontFace=cv2.FONT_HERSHEY_SIMPLEX, fontScale=1, color=(255, 255, 255), thickness=2)
def __getitem__(self, index):
indexes = self.indexes[index*self.batch_size: (index+1)*self.batch_size]
img_paths = [self.image_list[i] for i in indexes]
Y = [self.load_img(img_path) for img_path in img_paths]
X = [self.add_text(np.array(img)) for img in Y]
return np.array(X)/255, np.array(Y)/255
```
Let's see it in action:
```python
def plt_img(img: np, title: str = None):
plt.imshow(img)
plt.xticks([])
plt.yticks([])
if title is not None:
plt.title(title)
validation_imgs, train_imgs = train_imgs_list[:100], train_imgs_list[100:]
train_data_generator = DataGenerator(image_list=train_imgs)
validation_data_generator = DataGenerator(image_list=validation_imgs)
# Showing some sample images
X, Y = validation_data_generator[0]
plt.figure(figsize=(10,10))
cnt = 1;
for i in range(3):
plt.subplot(3,2, cnt)
plt_img(Y[i], "Original Image")
cnt += 1
plt.subplot(3, 2, cnt)
plt_img(X[i], "Augmented Image")
cnt += 1
plt.show()
```
# 3. Building the Model
We'll train a convolutional autoencoder on the cars dataset. Here's a simple nine-layer network that does the job:
```python
inputs = keras.layers.Input((256,256,3))
x = keras.layers.Conv2D(32, 3, padding='same', activation="relu")(inputs)
x = keras.layers.MaxPool2D()(x) # 128x128
x = keras.layers.Conv2D(8, 3, padding='same', activation="relu", name="bottle-neck")(x) # 128*128
x = keras.layers.UpSampling2D()(x) # 256x256
x = keras.layers.Conv2D(32, 3, padding='same', activation='relu')(x)
x = keras.layers.Conv2D(64, 3, padding='same', activation='relu')(x)
x = keras.layers.Conv2D(128, 3, padding='same', activation='relu')(x)
outputs = keras.layers.Conv2D(3, 1, padding='same', activation='relu')(x)
model = keras.Model(inputs, outputs)
model.compile(optimizer="adam", loss="mean_squared_error", metrics=['accuracy'])
model.summary()
```
```output
Model: "model"
_________________________________________________________________
Layer (type) Output Shape Param #
=================================================================
input_1 (InputLayer) [(None, 256, 256, 3)] 0
conv2d_2 (Conv2D) (None, 256, 256, 32) 896
max_pooling2d (MaxPooling2D (None, 128, 128, 32) 0
)
bottle-neck (Conv2D) (None, 128, 128, 8) 2312
up_sampling2d (UpSampling2D (None, 256, 256, 8) 0
)
conv2d_3 (Conv2D) (None, 256, 256, 32) 2336
conv2d_4 (Conv2D) (None, 256, 256, 64) 18496
conv2d_5 (Conv2D) (None, 256, 256, 128) 73856
conv2d_6 (Conv2D) (None, 256, 256, 3) 387
=================================================================
Total params: 98,283
Trainable params: 98,283
Non-trainable params: 0
_________________________________________________________________
```
I used mean squared error (MSE) as the loss, since the goal is simply for the model's output to match the original image as closely as possible. MSE does the job well here, though a loss that compares images region by region would likely work better for higher-resolution images or more general datasets. For this task, though, MSE is enough.
## 3.1 TensorBoard
To monitor training as it runs, we can use TensorBoard, a visualization tool built by the TensorFlow team. TensorBoard watches a directory (conventionally named `logs`) and renders the training logs it finds there — things like training and validation loss and accuracy — as live charts. It can also display images generated during training, such as the model's predictions at the end of each epoch, which is handy for judging by eye when the model has converged enough to stop training.
To capture those predictions, we define a custom callback that writes an image summary at the end of every epoch.
```python
class TensorBoardImageCallBack(keras.callbacks.Callback):
def __init__(self, log_dir, image, noisy_image):
super().__init__()
self.log_dir = log_dir
self.image = image
self.noisy_image = noisy_image
def set_model(self, model):
self.model = model
self.writer = tf.summary.create_file_writer(self.log_dir, filename_suffix='images')
def on_train_begin(self, _):
self.write_image(self.noisy_image, 'Noisy Image', 0)
self.write_image(self.image, 'Original Image', 0)
def on_train_end(self, _):
self.writer.close()
def write_image(self, image, tag, epoch):
image_to_write = np.copy(image)
with self.writer.as_default():
tf.summary.image(tag, image_to_write, step=epoch)
def on_epoch_end(self, epoch, logs={}):
denoised_image = self.model.predict_on_batch(self.noisy_image)
self.write_image(denoised_image, 'Denoised Image', epoch)
tensorboard_callback = TensorBoardImageCallBack('./logs', Y[1:2], X[1:2])
tensorboard_callback_loss = tf.keras.callbacks.TensorBoard(log_dir="./logs")
```
## 3.2 Training the Model
Now it's time to train the model. The code below is configured for 100 epochs, though I stopped training early, after 25, once the results looked good enough. Running the full 100 would likely push the model to a noticeably better convergence.
```python
history = model.fit(
train_data_generator,
epochs=100,
validation_data=validation_data_generator,
callbacks=[tensorboard_callback, tensorboard_callback_loss]
)
```
```output
...
502/502 [==============================] - 86s 171ms/step - loss: 6.6057e-04 - accuracy: 0.8184 - val_loss: 5.3678e-04 - val_accuracy: 0.8163
```
As the output above shows, after roughly 25 epochs the validation reconstruction loss is down to 5.3678e-04, which is already solid, and would likely improve further with the full 100 epochs. If we now feed the trained model a new image from the test set, the reconstruction loss stays low. But if we feed it something quite different from what it was trained on — an outlier or anomaly — the reconstruction loss spikes, because the network simply doesn't know how to reproduce it. That behavior is itself another common use case for autoencoders: anomaly detection.
One more thing worth noting: nothing stops you from using the encoder and decoder halves independently — the encoder alone to compress data, or the decoder alone to reconstruct it from a stored encoding. Here, we reduced the input image from $$256 \times 256 \times 3$$ down to $$128 \times 128 \times 8$$ at the bottleneck layer. Storing that compressed representation instead of the raw image shrinks the storage footprint by a factor of 1.5. Scaled up, a 900MB video would come down to about 600MB — a meaningful saving for storage-constrained applications.
$$\frac{256 \times 256 \times 3}{128 \times 128 \times 8} = 1.5$$
Model loss per epoch
> Note: in the figure above, the red line is validation loss and the blue line is training loss, per epoch.
Beyond denoising and anomaly detection, autoencoders are also widely used for learning compact, lower-dimensional data representations, and for super-resolution — enhancing an image's quality beyond its original resolution. We won't cover super-resolution here, but it's a natural follow-up experiment for a future article.
In this article, we used an autoencoder to remove a static watermark from a set of images — one of many practical use cases for the architecture. I hope you enjoyed the walkthrough. Stay tuned for more!
# References
1. [*G. E. Hinton, & R. R. Salakhutdinov (2006). Reducing the Dimensionality of Data with Neural Networks. Science, 313(5786), 504-507.*](https://paperswithcode.com/method/autoencoder)
---
# The Poisson Distribution
- URL: https://alinaderiparizi.com/blog/math/statistics/random-process/2022/07/14/the-poisson-distribution.html
- Date: 2022-07-14
- Kind: Blog post
- Topics: math, statistics, random-process
- Summary: A straightforward walk-through of a useful statistical concept, "The Poisson Distribution"
# 1. Intro
Statistics is an essential skill for a computer engineer, a data scientist, or a machine-learning engineer to have in their professional career. In most universities, though, we learn statistics the same way we learn differential equations or calculus: a long list of formulas with little connection to real-world use. We memorize plenty of mathematical basics we'll never actually use, which gets in the way of seeing what statistics can really do for us in the real world.
In this article, we are about to learn two crucial statistics concepts, The Poisson Distribution and The Poisson Process, through solving a common problem in the concept of online website hosting.
# 2. What Poisson Distribution or Poisson Process is about?
Before we get started, let's first ask ourselves a simple question: "Why do we need Poisson?"
The Poisson distribution helps us predict the probability of a given number of events occurring in a fixed interval of time, or, more simply, to predict the number of events in the future.
For example,
- How many visitors do you get on your website in a day?
- How many clicks do your ads get for the next month?
- How many phone calls do you get during your shift?
- How many people will die from covid-19 next year?
Every week, on average, 17 people react to my blog posts by emailing me. I'd like to predict how many people will react to my posts next week, so I can set aside enough free time to answer them properly, planning ahead matters a lot to me.
What is the probability that exactly 20 people (or 10, 30, 40, etc.) will react to my posts next week?
To answer this question, if we knew some statistics, it would come to our minds that we should be able to solve this problem using **the Binomial distribution**. Let's first look at the concept of the Binomial distribution and solve the problem using it.
# 3. Binomial distribution
One way to solve this is to start with the number of reads. Each person who reads the blog has some probability of actually having a question or finding something interesting enough to share with me.
A binomial random variable is the number of successes $$x$$ in $$n$$ repeated trials. And we assume the probability of success $$p$$ is constant over each trial. The Binomial distribution formula is:
\begin{equation}
P[X=x] = \binom{n}{x}p^x(1-p)^{n-x}
\end{equation}
However, here we are given only one piece of information, $$17 \frac{emails}{week}$$, which is a rate. We don't know anything about the probability that an individual reader sends an email, $$p$$, nor the number of blog visitors, $$n$$. So, we use Google Analytics to retrieve this data from our blog history.
Stats from Google
By looking at the stats we can say that, in one year, a total of $$59k$$ people read my blog. Out of those $$59k$$ people, $$888$$ of them liked my post. Therefore, the number of people who read my blog per week ($$n$$) is $$\frac{59k}{52}=1134$$. The number of people who liked my posts per week ($$x$$) is $$\frac{888}{52}=17$$. So, the success probability $$p$$ would be $$\frac{888}{59k} = 0.015$$ or $$1.5\%$$.
Now Using Binomial PMF, we should be able to calculate the probability of getting 20 emails for next week as below:
$$P[X=20] = \binom{1134}{20}(0.015)^{20}(1-0.015)^{1134-20} = 0.06962$$
We can use python or any other programming language to calculate the probability of getting emails with different values.
```python
from scipy.stats import binom
# setting the values
# of n, p and x
n = 1134
p = 0.015
x_s = [10, 17, 20, 30, 40]
print(f"x\tBinomial P(x, n, p)")
print("----------------------------")
for x in x_s:
print(f"{x}:\t{binom.pmf(x, n, p)}")
```
```output
x Binomial P(x, n, p)
----------------------------
10: 0.022507172903122208
17: 0.09701415708780352
20: 0.06962037106916726
30: 0.0012106250995813465
40: 6.815731666708672e-07
```
As you can see, by using the binomial distribution, the probability of getting 10, 17, 20, 30, and 40 emails per week is as follows:
| x | Binomial P(X=x) |
|----|:-----------------:|
| 10 | 0.02250 |
| 17 | 0.09701 |
| 20 | 0.06962 |
| 30 | 0.00121 |
| 40 | < 0.000001 |
# 4. Shortcomings of the Binomial Distribution
The very first problem with a binomial random variable is that "**it's assumed to be binary (0 or 1)**". In the previous example, we have $$17 \frac{emails}{week}$$. This means $$\frac{17}{7}=2.4$$ people will send me emails per day, and $$\frac{17}{7 \times 24} = 0.1$$ people send me an email per hour.
If we model the success probability by hour (0.1 email/hr) using a binomial random variable, this means most hours get zero emails, but some hours get exactly one. However, it's also entirely possible that a given hour gets more than one email (2, 3, 5, etc.).
The problem with binomial is that it can't contain more than one event per unit of time (in this case, one hour is the unit of time). The unit of time can only have 0 or 1 event.
How about dividing that one hour into 60 minutes, making the unit of time smaller? If we do that, one hour can now contain multiple events (though a single minute will still contain exactly zero or one). But what if, during that one minute, we get multiple emails, say, someone shares my blog post on Twitter and traffic spikes at that exact minute? Then what? We can divide a minute into seconds, making a second our new unit of time, and again a minute can contain multiple events. But this binary-container problem persists no matter how small we make the unit of time. The idea is that we can make the binomial random variable handle multiple events by dividing the unit of time into ever-smaller pieces. By doing that, we let the original unit of time contain more than one event. Mathematically, this means $$n$$ goes to infinity. Since we've assumed the rate is fixed, $$p$$ must go to zero: as $$n$$ grows toward infinity, the number of intervals grows along with it, and the probability of getting an email in any single interval shrinks toward zero. In other words, if $$n$$ goes to infinity, $$p$$ must go to zero, otherwise $$np$$, which is the expected number of events, would blow up.
The second problem with the binomial random variable is that "**to use the binomial distribution, the number of trials, $$n$$, and the probability of success, $$p$$, must be known**".
If you use Binomial, you cannot calculate the success probability with just the rate (i.e. $$17\frac{emails}{week}$$). You need the additional information $$n$$ and $$p$$ in order to use the binomial PMF.
The Poisson Distribution, on the other hand, doesn't require you to know $$n$$ or $$p$$. We are assuming $$n$$ is infinitely large ($$n\rightarrow\infty$$) and $$p$$ is infinitesimal ($$p\rightarrow 0$$).
The only parameter of the Poisson distribution is the rate $$\lambda$$. (In real life only knowing the rate is much more common than knowing both $$n$$ and $$p$$)
# 5. Derive the poisson formula mathematically
Now let's dive into the binomial distribution formula, starting from the conclusion we reached in the previous section ([Section 4](#4-shortcomings-of-the-binomial-distribution)): to deal with the binary nature of the binomial random variable, we should increase the number of time units in our one-week interval. Mathematically, this means $$n\rightarrow\infty$$:
$$P[X=x] = lim_{n\rightarrow\infty}\binom{n}{x}p^x(1-p)^{n-x}$$
If, $$n\rightarrow\infty$$ and $$p\rightarrow 0$$ then we can assume that:
$$p = \frac{\lambda}{n}$$
Then we have:
$$P[X=x] = lim_{n\rightarrow\infty}\binom{n}{x}(\frac{λ}{n})^x(1- (\frac{λ}{n}))^{n-x}$$
$$ \Rightarrow lim_{n\rightarrow\infty} \frac{n!}{(n-x)!x!}(\frac{λ}{n})^x(1- (\frac{λ}{n}))^{n-x}$$
$$\Rightarrow lim_{n\rightarrow\infty} \frac{n!}{(n-x)!}\frac{1}{n^x}\frac{λ^x}{x!}(1-\frac{λ}{n})^n(1-\frac{λ}{n})^{-x}$$
$$\Rightarrow lim_{n\rightarrow\infty} \frac{n!}{(n-x)!}\frac{1}{n^x}\frac{λ^x}{x!}e^{-λ}(1)$$
Because:
$$lim_{n\rightarrow\infty}\frac{n!}{(n-x)!}\frac{1}{n^x} = 1$$
We can say:
\begin{equation}
P[X=x] = e^{-λ}\frac{λ^{x}}{x!}
\end{equation}
Which is actually the Poisson random distribution formula.
# 6. Probability of events for a Poisson distribution
An event can occur 0, 1, 2, … times in an interval. The average number of events in an interval is designated λ. λ is the event rate, also called the rate parameter. The probability of observing k events in an interval is given by the equation:
$$P[k\ events\ in\ interval] = e^{-λ}\frac{λ^{k}}{k!}$$
Where:
- $$\lambda$$ is the average number of events per interval
- $$e$$ is the number $$2.71828…$$ (Euler’s number) the base of the natural logarithm
- $$k$$ takes values $$0, 1, 2, …$$
- $$k! = k(k-1)(k-2)…(2)(1)$$ is the factorial of $$k$$
We calculate the probability of observing 10, 17, 20, 30 and 40 emails in the interval using the poisson distribution formula as below:
```python
from scipy.stats import poisson
#calculate probability
# setting the values
# of lambda and x
l = 17
x_s = [10, 17, 20, 30, 40]
print(f"x\tPoisson P(x, lambda)")
print("----------------------------")
for x in x_s:
print(f"{x}:\t{poisson.pmf(k=x, mu=l)}")
```
```output
x Poisson P(x, lambda)
----------------------------
10: 0.022999584406166312
17: 0.09628462779844556
20: 0.06915882695522822
30: 0.001278796308921649
40: 8.381188233781985e-07
```
As you can see, the probabilities calculated using the Poisson formula are very close to the values from the Binomial distribution formula, so we can conclude that the Poisson distribution is a really good approximation for our problem in this case. Because of its simpler formula and its single, easy-to-obtain parameter, the Poisson distribution is very useful for solving problems of this kind.
| x | Binomial P(X=x) | Poisson P(X=x;lambda=17) |
|----|:-----------------:|:-------------------------:|
| 10 | 0.02250 | 0.02300 |
| 17 | 0.09701 | 0.09628 |
| 20 | 0.06962 | 0.06916 |
| 30 | 0.00121 | 0.00128 |
| 40 | < 0.000001 | < 0.000001 |
# 7. Some notes on Poisson random variable
Even though the Poisson distribution is often used to model rare events, the rate $$\lambda$$ can be any number, it doesn't always have to be small. The Poisson Distribution is asymmetric, always skewed toward the right, because it's bounded by the zero-occurrence barrier (there's no such thing as minus one email) on the left, while it's unbounded on the right. As $$\lambda$$ becomes bigger, the graph looks more like a normal distribution.
```python
from scipy.stats import poisson
import matplotlib.pyplot as plt
x_s = [i for i in range(0, 40, 5)]
plots = []
mus = [5, 10, 15, 17, 20]
for mu in mus:
y_s = []
for x in x_s:
y_s += [poisson.pmf(k=x, mu=mu)]
plots += [(x_s, y_s)]
plt.figure(figsize=(10,10))
for i in range(len(plots)):
plt.plot(plots[i][0], plots[i][1], label=f"lambda = {mus[i]}")
plt.legend(loc='best')
plt.show()
```
Poisson distribution with different lambda's for our problem.
**The average rate of events per unit time in a Poisson distribution is constant**. This means the number of people who visit my blog per hour might not follow a Poisson Distribution, because the hourly rate is not constant (higher during the daytime, lower during the night). Using a monthly rate for consumer or biological data would also be just an approximation, since seasonality effects are non-trivial in that domain.
**In a Poisson random variable, events are independent**. The arrival of my blog's visitors might not always be independent. For example, sometimes a large number of visitors arrive together because someone popular mentioned my blog, or my blog got featured on Medium's front page, etc. Similarly, the number of earthquakes per year in a country might not follow a Poisson Distribution either, since one large earthquake increases the probability of aftershocks.
# References
1. S. M. Ross. *A First Course in Probability*. Pearson. (Binomial-to-Poisson limit derivation, Poisson process.)
2. SciPy. `scipy.stats.poisson`. [docs.scipy.org/.../scipy.stats.poisson.html](https://docs.scipy.org/doc/scipy/reference/generated/scipy.stats.poisson.html)
3. SciPy. `scipy.stats.binom`. [docs.scipy.org/.../scipy.stats.binom.html](https://docs.scipy.org/doc/scipy/reference/generated/scipy.stats.binom.html)
---
# LeNet-5 from scratch
- URL: https://alinaderiparizi.com/blog/ai/machine-learning/deep-learning/2022/06/21/lenet5.html
- Date: 2022-06-21
- Kind: Blog post
- Topics: ai, machine-learning, deep-learning
- Summary: In this article, we perform image classification on the MNIST dataset with a custom-implemented LeNet-5 neural network architecture.
# 1. Introduction
LeNet-5 was one of the earliest deep learning models, introduced in 1998 in the paper "Gradient-Based Learning Applied to Document Recognition" by Yann LeCun, Léon Bottou, Yoshua Bengio, and Patrick Haffner. Several of these authors went on to make major contributions to the field of deep learning.
From left: Yann LeCun, Leon Bottou, Yoshua Bengio, and Patrick Haffner
This article introduces the LeNet-5 CNN architecture as described in the original paper, walks through an implementation using TensorFlow 2.0, and finishes by using that implementation to classify images from the MNIST dataset.
What you'll find in this article:
- An overview of the components that make up a convolutional neural network
- Definitions of terms commonly used in deep learning and machine learning
- A walkthrough of the LeNet-5 architecture as presented in the original paper
- An implementation of the network using TensorFlow and Keras
This article is written for deep learning and machine learning students of all levels. If you're eager to get to the code, jump straight to the [**Implementation**](#implementation) section.
# 2. Convolutional Neural Networks
Convolutional neural networks (CNNs) are the standard architecture for tasks involving images. Object detection, face detection, pose estimation, and many other computer vision tasks are usually solved with some variant of a CNN.
A handful of characteristics make CNNs particularly well suited to computer vision tasks. Before diving into LeNet-5, it's worth introducing them:
- Local receptive fields
- Sub-sampling
- Weight sharing
The LeNet-5 architecture is made up of seven layers: three convolutional layers, two sub-sampling layers, and two fully connected layers.
LeNet architecture
The diagram above shows the LeNet-5 architecture as illustrated in the original paper.
The first layer is the input layer, which isn't generally counted as a true layer of the network since nothing is learned there. It's built to accept 32x32 images. Since MNIST images are 28x28, they're padded to meet the input layer's requirements.
In the original paper, pixel values were normalized from the 0–255 range to roughly -0.1 to 1.175, giving each batch of images a mean of 0 and a standard deviation of 1 — this speeds up training. In the implementation below, we'll instead normalize pixel values to the simpler 0–1 range.
**LeNet-5 relies on two main types of layers: convolutional layers and sub-sampling layers.**
- Convolutional layers
- Sub-sampling layers
In the paper and in the diagram above, convolutional layers are labeled `Cx`, sub-sampling layers `Sx`, and fully connected layers `Fx`, where `x` is the layer's position within the network.
The first convolutional layer, C1, produces 6 feature maps using a 5x5 kernel. The kernel (or filter) is the window of weights convolved with the input; its 5x5 size also defines the local receptive field of each unit in the layer. Given a 32x32 input, the six feature maps produced by C1 are 28x28.
> Note: for simplicity, the implementation below skips the padding step and feeds the network 28x28 images directly. That's why the layer dimensions in the table and code further down are slightly smaller than in the original paper — for example, C1 outputs 24x24 feature maps instead of 28x28.
A sub-sampling layer, S2, follows C1. S2 halves the dimensions of the feature maps it receives — commonly known as downsampling — and produces 6 feature maps, one for each feature map passed in from the previous layer. [This link](https://en.wikipedia.org/wiki/Convolutional_neural_network#Pooling_layers) has more information on sub-sampling (pooling) layers.
The remaining layers are covered in the implementation section below. Here's a summary of the network we'll actually build:
| Layer name | Input | Kernel size | Output | Activation |
|:---------------:|:-------:|:-------------:|:--------:|:------------:|
| Input | 28x28x1 | None | 28x28x1 | None |
| Convolution 1 | 28x28x1 | 5x5 | 24x24x6 | ReLU |
| Max pooling 1 | 24x24x6 | 2x2 | 12x12x6 | None |
| Convolution 2 | 12x12x6 | 5x5 | 8x8x16 | ReLU |
| Max pooling 2 | 8x8x16 | 2x2 | 4x4x16 | None |
| Flatten | 4x4x16 | None | 256x1 | None |
| Dense 1 | 256x1 | None | 120x1 | ReLU |
| Dense 2 | 120x1 | None | 84x1 | ReLU |
| Dense 3 | 84x1 | None | 10x1 | Softmax |
# 3. Implementation
{: #implementation}
We'll start by importing the libraries we need:
- TensorFlow: an open-source platform for building, training, and deploying machine learning models.
- Keras: TensorFlow's high-level neural network API, used for defining architectures that run on both CPU and GPU.
- NumPy: a library for numerical computation with n-dimensional arrays.
```python
import sys
import numpy as np
from tensorflow import keras
from tensorflow.keras import layers, losses, optimizers
from tensorflow.keras.datasets import mnist
from matplotlib import pyplot as plt
```
## Loading and preparing the data
Next, we load the MNIST dataset through Keras, which ships with a handful of ready-to-use datasets.
We also need to split the data into training, validation, and test sets:
- **Training set**: the data the network learns from directly during training.
- **Validation set**: used during training to track how well the network generalizes after each epoch.
- **Test set**: used once training is complete, to evaluate the network on data it has never seen.
Pixel intensities also need to be normalized from the 0–255 range down to 0–1 before training.
Below, we load the dataset and visualize a handful of random training samples to get a feel for the data:
```python
(xTrain, yTrain), (xTest, yTest) = mnist.load_data()
plt.figure(figsize=(10,10))
indexes = np.random.randint(0, len(xTrain), 9)
for i in range(len(indexes)):
plt.subplot(3,3,i+1)
plt.imshow(xTrain[indexes[i]])
plt.title(yTrain[indexes[i]])
plt.show()
```
## Building the model
The code below implements the LeNet-5-inspired network described above, using Keras's functional API to connect layers:
```python
numClasses = 10
inputs = layers.Input((28,28,1))
x = layers.Conv2D(6, 5, activation="relu")(inputs)
x = layers.MaxPool2D()(x)
x = layers.Conv2D(16, 5, activation="relu")(x)
x = layers.MaxPool2D()(x)
x = layers.Flatten()(x)
x = layers.Dense(120, activation="relu")(x)
x = layers.Dense(84, activation="relu")(x)
outputs = layers.Dense(numClasses)(x)
leNet5 = keras.Model(inputs=inputs, outputs=outputs)
leNet5.compile(
loss = losses.SparseCategoricalCrossentropy(from_logits=True),
optimizer = optimizers.Adam(),
metrics = ["accuracy"]
)
leNet5.summary()
```
```output
Model: "model"
_________________________________________________________________
Layer (type) Output Shape Param #
=================================================================
input_1 (InputLayer) [(None, 28, 28, 1)] 0
_________________________________________________________________
conv2d (Conv2D) (None, 24, 24, 6) 156
_________________________________________________________________
max_pooling2d (MaxPooling2D) (None, 12, 12, 6) 0
_________________________________________________________________
conv2d_1 (Conv2D) (None, 8, 8, 16) 2416
_________________________________________________________________
max_pooling2d_1 (MaxPooling2) (None, 4, 4, 16) 0
_________________________________________________________________
flatten (Flatten) (None, 256) 0
_________________________________________________________________
dense (Dense) (None, 120) 30840
_________________________________________________________________
dense_1 (Dense) (None, 84) 10164
_________________________________________________________________
dense_2 (Dense) (None, 10) 850
=================================================================
Total params: 44,426
Trainable params: 44,426
Non-trainable params: 0
```
We build the network with Keras's functional API: each layer is called on the output of the previous one, and `keras.Model` ties the resulting graph together from `inputs` to `outputs`.
The C1 layer is created with `layers.Conv2D(6, 5, activation="relu")`, producing 6 feature maps from a 5x5 kernel with a ReLU activation. The second convolutional layer, C3, follows the same pattern with a different number of filters.
- **Activation function**: a mathematical operation that transforms the output of a neuron into a normalized signal. Activation functions introduce non-linearity into a network, which gives it the representational power to learn complex functions.
> Note: the original paper used the hyperbolic tangent (tanh) activation and average pooling for its sub-sampling layers — averaging the pixel values in each 2x2 window, scaling the result by a learned coefficient, adding a bias, and then applying the activation function. Our implementation uses the simpler and more modern combination of ReLU activations with max pooling (`layers.MaxPool2D()`), which trains faster and performs just as well on MNIST.
There are two more layer types in the network: the flatten layer and the dense layers.
`layers.Flatten()` reshapes its input into a 1-dimensional array so it can be fed into the dense layers that follow.
The dense layers each have a fixed number of units: 120, then 84, then 10 — matching the number of classes in MNIST. The final dense layer outputs logits, which are converted into a probability distribution using a softmax activation.
- **Softmax**: an activation function that turns a vector of numbers into a probability distribution. Each value in the output represents the probability of a particular class, and all the values sum to 1.
Keras's `compile` method finalizes the model, attaching the loss function, optimizer, and metrics that will be used during training.
We train with `SparseCategoricalCrossentropy` as our loss function, which measures the difference between the network's predictions and the true labels. The Adam optimizer uses these loss values to update the network's weights; factors like momentum and learning rate scheduling help training converge, driving the loss toward zero.
During training, we validate the model after every epoch using the test dataset partition created earlier:
```python
history = leNet5.fit(xTrain, yTrain, validation_data=(xTest,yTest), batch_size=64, epochs=10)
```
```output
Epoch 1/10
938/938 [==============================] - 10s 10ms/step - loss: 1.1559 - accuracy: 0.7988 - val_loss: 0.1056 - val_accuracy: 0.9681
Epoch 2/10
938/938 [==============================] - 9s 10ms/step - loss: 0.0982 - accuracy: 0.9690 - val_loss: 0.0759 - val_accuracy: 0.9763
Epoch 3/10
938/938 [==============================] - 9s 10ms/step - loss: 0.0595 - accuracy: 0.9809 - val_loss: 0.0706 - val_accuracy: 0.9792
Epoch 4/10
938/938 [==============================] - 9s 10ms/step - loss: 0.0545 - accuracy: 0.9836 - val_loss: 0.0723 - val_accuracy: 0.9770
Epoch 5/10
938/938 [==============================] - 9s 10ms/step - loss: 0.0472 - accuracy: 0.9856 - val_loss: 0.0594 - val_accuracy: 0.9825
Epoch 6/10
938/938 [==============================] - 9s 10ms/step - loss: 0.0364 - accuracy: 0.9877 - val_loss: 0.0532 - val_accuracy: 0.9850
Epoch 7/10
938/938 [==============================] - 9s 10ms/step - loss: 0.0358 - accuracy: 0.9887 - val_loss: 0.0813 - val_accuracy: 0.9776
Epoch 8/10
938/938 [==============================] - 10s 10ms/step - loss: 0.0333 - accuracy: 0.9895 - val_loss: 0.0682 - val_accuracy: 0.9829
Epoch 9/10
938/938 [==============================] - 9s 10ms/step - loss: 0.0271 - accuracy: 0.9916 - val_loss: 0.0618 - val_accuracy: 0.9839
Epoch 10/10
938/938 [==============================] - 9s 10ms/step - loss: 0.0265 - accuracy: 0.9913 - val_loss: 0.0729 - val_accuracy: 0.9835
313/313 [==============================] - 1s 3ms/step - loss: 0.0729 - accuracy: 0.9835
```
After ten epochs, the model reaches a validation accuracy of around 98%. For a more explicit check of how well it generalizes, we run a final evaluation on the test dataset:
```python
leNet5.evaluate(xTest, yTest)
```
```output
[0.07292196899652481, 0.9835000038146973]
```
The final model achieves 98.35% accuracy on the test set — a strong result for such a simple network.
# 4. Analyzing training and performance
## Confusion matrix
```python
from sklearn.metrics import confusion_matrix, accuracy_score
yPred = leNet5.predict(xTest)
yPred = np.argmax(yPred, axis=-1)
conf = confusion_matrix(yTest, yPred, normalize=None)
accuracy = accuracy_score(yPred, yTest)
print("Accuracy Score:", accuracy)
plt.imshow(conf)
plt.title("Confusion matrix")
plt.show()
```
## Training and validation loss
```python
loss_train = history.history['loss']
loss_val = history.history['val_loss']
epochs = range(1,11)
plt.plot(epochs, loss_train, 'g', label='Training loss')
plt.plot(epochs, loss_val, 'b', label='validation loss')
plt.title('Training and Validation loss')
plt.xlabel('Epochs')
plt.ylabel('Loss')
plt.legend()
plt.show()
```
You can find the complete project code in my GitHub repository [**here**](https://github.com/mralinp/cnn-networks/tree/main/lenet5).
I hope you found this article useful!
# References
1. Y. LeCun, L. Bottou, Y. Bengio, P. Haffner. Gradient-based learning applied to document recognition. *Proceedings of the IEEE* 86(11):2278–2324, 1998. [doi:10.1109/5.726791](https://doi.org/10.1109/5.726791)
2. Y. LeCun, C. Cortes, C. J. C. Burges. The MNIST Database of Handwritten Digits. [yann.lecun.com/exdb/mnist](http://yann.lecun.com/exdb/mnist/)
3. TensorFlow. `tf.keras.layers.Conv2D` / functional API guide. [tensorflow.org/guide/keras/functional](https://www.tensorflow.org/guide/keras/functional)
4. Wikipedia. Convolutional neural network — pooling layers. [en.wikipedia.org/wiki/Convolutional_neural_network#Pooling_layers](https://en.wikipedia.org/wiki/Convolutional_neural_network#Pooling_layers)
---
# Snake game
- URL: https://alinaderiparizi.com/project/game/python/entry-level/2022/03/21/snake-game.html
- Date: 2022-03-21
- Kind: Project
- Topics: game, python, entry-level
- Code: https://github.com/mralinp/simple-python-snake
- Summary: Snake game is a very cool and informative mini project for beginners. In this post we implement a simple snake game from scratch in Python, in the terminal, with no game libraries.
# 1. Intro
Hello there, this is Ali speaking. When I started studying computer engineering at Shiraz University, CSE101 was the introductory course we had to take to get familiar with basic programming concepts. That's where I was introduced to the **Python** programming language for the first time. Python is a very cool language with practical uses in almost every field: data science, machine learning, web development, game development, and more.
Now I use Python almost every day of my academic career, so it was an excellent choice to begin with. It wasn't my first language, though. In my first year of high school I learned **C**, which I used to solve math problems, just for fun. I had no source to learn from except our computer teacher and an ancient book based on **Borland C++** running on **MS-DOS**. We didn't have internet access at home or at school back then, so the only way to learn was reading books and asking questions. So CSE101 was the most straightforward course of my life. I never studied the syllabus; I just learned everything about Python I could find on the internet. The course's final project was **"Making a Very Simple Snake Game"** (like the old-school Nokia game), without advanced libraries or frameworks such as PyGame.
In this article we implement that **Very Simple Snake Game**. The full source is on [GitHub](https://github.com/mralinp/simple-python-snake). It's the actual code I handed in back then (Fall 2015), uploaded in 2020, bugs and all.
The main menu, drawn entirely with colored characters in a terminal.
# Table Of Contents
- [1. Intro](#1-intro)
- [2. Problem Statement](#2-problem-statement)
- [3. Challenges of The Project](#3-challenges-of-the-project)
- [4. Solution and Design](#4-solution-and-design)
- [5. Implementation](#5-implementation)
- [6. Final words](#6-final-words)
# 2. Problem Statement
Develop a straightforward snake game like the one on old-school Nokia phones. A single snake moves around the game world. You control the snake using the arrow keys or `W`, `A`, `S` and `D` to move `UP`, `LEFT`, `DOWN` and `RIGHT`. At random times, an apple (food) appears on a random spot of the map. If the snake eats it, its tail grows by one unit and the player gets 100 points. The map can contain walls or obstacles. The player loses if the snake hits a wall or its own tail. Pressing `Esc` pauses and unpauses the game. The score must be stored after each game.
> Note: Any creative ideas that improve performance, game experience or appearance count as bonuses: a menu, several levels, even a storyline.
And the one rule that makes it interesting: **no game or GUI libraries**. No PyGame, no wxPython. The only thing allowed was [colorama](https://pypi.org/project/colorama/), for colors and cursor positioning, and even doing that yourself was a bonus.
# 3. Challenges of The Project
It sounds like a toy, but three things in it are genuinely hard for a first-semester student:
1. **Drawing at a position.** `print()` writes wherever the cursor happens to be, line after line. A game needs to put a character at column 12, row 5, and later erase it.
2. **Non-blocking input.** `input()` stops the whole program until you press Enter. A snake has to keep moving whether you touch the keyboard or not, and react the moment you do.
3. **Flicker.** The obvious approach, clearing the screen and redrawing everything every frame, makes the terminal blink like crazy.
# 4. Solution and Design
As the game world is the console and no graphics libraries are allowed, everything in the game is just a character. The snake is a row of `O`s, food is `A`, and walls are `#`. The board is a 40×16 blue rectangle.
The code is split into four small modules:
| Module | Job |
| --- | --- |
| `display.py` | print a string at `(x, y)` with a color, background and intensity; draw rectangles; clear the screen |
| `keyboard_manager.py` | non-blocking keyboard input on Linux, macOS and Windows |
| `db.py` | save and load `name:score` lines in a text file |
| `source.py` | the menu, the game state machine and the main loop |
**The game is a state machine.** A single variable, `g_state`, says where we are, and the main loop only does what that state allows:
| `g_state` | Meaning |
| --- | --- |
| 0 | main menu |
| 1 | start a new game |
| 2 | score board |
| 3 | exit |
| 4 | game drawn, waiting for the first key |
| 5 | game running |
| 6 | game over |
| 7 | paused |
Looking back, this was the best decision in the project. Pausing, the score board and the menu all became "just another state" instead of special cases scattered around the loop.
**Only draw what changed.** This is the answer to flicker. The board is drawn once when the game starts. After that, when the snake moves one step, only two cells actually change: the old tail cell becomes empty and the new head cell becomes `O`. So each frame writes exactly two characters instead of 640.
# 5. Implementation
## 5.1 Printing at (x, y)
Terminals understand ANSI escape codes. `ESC[y;xH` moves the cursor, `ESC[31m` sets a red foreground, `ESC[44m` a blue background, and so on. colorama's `init()` makes those codes work on Windows too. With that, the whole graphics engine is one function:
```python
def print_XY(msg, x=1, y=1, color='reset', bg_color='reset', intensity='reset'):
s = '\033[' + str(y) + ';' + str(x) + 'H' # move the cursor
s = s + '\033[' + color_map[color] + 'm' # text color
s = s + '\033[' + bg_color_map[bg_color] + 'm' # background
s = s + '\033[' + intensity_map[intensity] + 'm' # brightness
print(s + msg)
```
A rectangle is `print_XY(' ', ...)` in a double loop, and moving a character is erasing it at the old spot and printing it at the new one:
```python
def swap(msg, p, s, color="reset", bg_color="reset", intensity="reset"):
print_XY(" ", p[0], p[1], color, bg_color, intensity) # erase the old position
print_XY(msg, s[0], s[1], color, bg_color, intensity) # draw at the new one
```
## 5.2 Non-blocking input
This was the part I understood least at the time. I pieced it together from Stack Overflow answers and changed it until it worked. Today it's easy to explain.
Your program never talks to the keyboard directly; the operating system does, and by default the terminal is in *canonical* mode: it echoes what you type and only hands your program the line once you press Enter. That's exactly what `input()` wants, and exactly what a game doesn't.
So on Linux and macOS, `KBHit` switches the terminal out of canonical mode and turns off echo with `termios`, and registers an `atexit` hook to put it back when the game exits. Then `select()` with a timeout of `0` asks "is there anything to read right now?" without waiting:
```python
def no_echo(self):
self.__fd = sys.stdin.fileno()
self.__new_term = termios.tcgetattr(self.__fd)
self.__old_term = termios.tcgetattr(self.__fd)
# no line buffering, no echo
self.__new_term[3] = (self.__new_term[3] & ~termios.ICANON & ~termios.ECHO)
termios.tcsetattr(self.__fd, termios.TCSAFLUSH, self.__new_term)
atexit.register(self.set_normal_term)
def kbhit(self):
dr, dw, de = select([sys.stdin], [], [], 0)
return dr != []
```
On Windows, `msvcrt.kbhit()` and `msvcrt.getch()` do all of this for you.
Arrow keys had one more surprise. They don't send one byte; they send three: `ESC`, `[`, and a letter (`A` up, `B` down, `C` right, `D` left). So `getch()` reads one byte, and if it's `ESC`, reads two more and returns the letter:
```python
c = sys.stdin.read(1)
if c == '\x1b':
return sys.stdin.read(2)[1]
return c
```
The catch: the `Esc` key on its own *also* sends `\x1b`, and then `getch()` sits waiting for two bytes that never come. I never solved that in the course, which is why the game pauses with `p` instead of `Esc`, and quits with `q`.
## 5.3 The snake
The snake is a list of `(x, y)` points, head first. The direction is a vector:
```python
key_direction_map = {0x01: (0, -1), 0x02: (0, 1), 0x03: (-1, 0), 0x04: (1, 0)}
```
Moving is adding the direction to the head, putting the new head in front and dropping the last point:
```python
s = snake[0]
s = s[0] + m_dir[0], s[1] + m_dir[1]
p = snake[-1]
snake = [s] + snake[:-1]
display.swap('O', p, s, "red", "blue", "bright")
```
A few small tricks make it feel like a snake:
- **No U-turns.** If the new direction is the exact opposite of the current one, the two vectors add up to `(0, 0)`, and the key is ignored. Otherwise pressing "left" while going right would kill you instantly.
- **Wrap-around.** Leaving the board on one side brings you back on the other, like the Nokia version.
- **Growing.** When the head lands on food, the last segment is duplicated: `snake = snake + [snake[-1]]`. On the next move the tail stays where it is while the head moves on, so the snake is one cell longer.
- **Losing.** You lose when the head is inside the rest of the body (`snake[0] in snake[1:]`) or inside a wall.
## 5.4 Timing and food
The main loop sleeps 1 ms per iteration so it doesn't burn a CPU core, and checks the keyboard every iteration so input feels instant. But the snake only moves once every 50 iterations (`speed_counter_limit`). Separating "how often we read input" from "how often the snake moves" is what made it playable.
Food follows the same idea: a countdown set to a random 500–2000 iterations, and when it hits zero a new apple appears, up to three on the board. The spot is picked by listing every cell on the board, removing the ones taken by the snake, walls and other food, and taking `random.choice` of what's left. That's slow (it rebuilds a 640-cell list every time), but it can never place food on the snake.
In game: the snake (OOOO), three apples, and the score.
## 5.5 Saving scores
When the game ends, the terminal goes back to normal mode so `input()` works again, the game asks for "Your Beautiful name?", and `db.py` appends `name:score` to a text file. The score board reads that file back and prints it with alternating row colors. No database, no JSON, just a text file, which was exactly enough.
# 6. Final words
Reading this code again years later, I can see everything wrong with it. It's one big `while` loop with magic numbers for states. The walls feature exists but the list is always empty. Food gives 50 points instead of the 100 the statement asked for. `Esc` doesn't work. Speed depends on how fast your machine runs the loop.
But I can also see why it worked, and why this was such a good first project. In a few hundred lines it forced me to learn things no "hello world" does: how a terminal actually works, what the operating system does with your keystrokes, why a game loop exists, why you redraw only what changed, and how a state machine keeps a program from turning into spaghetti. I use every one of those ideas to this day.
If you're a student with the same assignment, feel free to read the [code](https://github.com/mralinp/simple-python-snake), but write your own. Fixing the `Esc` key is a great place to start.
---
# Hello, world!
- URL: https://alinaderiparizi.com/blog/hello-world/2022/03/20/hello-world.html
- Date: 2022-03-20
- Kind: Blog post
- Topics: hello-world
- Summary: This is my first post on the blog on the first day of the new century. Happy nowrooz to all people around the world!
This is my first blog post on the first day of the new century (1401-01-01 00:00:00 +330).
```bash
$ echo "Hello, world!"
```