This is the first post of a series following abus-classification, a project classifying malignant and benign breast lesions in 3D automated breast ultrasound (ABUS). I’ll add one post per phase of the project — this one is background, with no results yet: what a breast tumor is, how it gets imaged, and why this project uses 3D ultrasound specifically. The next post covers the classical radiology features we reproduce as a baseline; the one after that covers the deep-learning approaches.
1. What we’re actually looking for
A breast tumor is a mass of tissue that grows where it shouldn’t. Most breast masses are benign — fibroadenomas, cysts, areas of fibrocystic change — and are not life-threatening. The ones that matter are malignant: cancer cells that, left alone, can invade surrounding tissue and spread elsewhere in the body. The entire point of breast imaging is to find a mass and estimate, without cutting the patient open, whether it’s one or the other.
Imaging alone cannot give a definitive answer. A mammogram or an ultrasound scan produces an image that a radiologist scores on the BI-RADS scale, from “definitely benign” to “highly suggestive of malignancy” — a risk estimate, not a diagnosis. The only way to know for certain is a biopsy: a small sample of tissue examined under a microscope by a pathologist. What imaging is for is deciding who needs a biopsy in the first place, and increasingly, helping the radiologist read the image faster and more consistently. That second role — computer-aided reading — is what this project is ultimately building toward.
2. Two very different ways to make an image
Mammography and ultrasound solve the same problem — see inside the breast without surgery — using completely different physics, and that’s why they see different things.
Mammography sends X-rays through the compressed breast and records how much of each ray gets absorbed on the way through. Denser tissue (glandular and fibrous tissue, and tumors, which tend to be denser than surrounding fat) absorbs more X-rays and shows up brighter; fat absorbs little and shows up dark. It’s a projection, like a shadow: the whole breast thickness is compressed into one flat 2D image (two, usually — craniocaudal and mediolateral-oblique views, to get some sense of depth by triangulation). Mammography is very good at one thing in particular: microcalcifications, tiny calcium deposits as small as a fraction of a millimetre, which show up as bright specks and are an early sign of some cancers, well before a mass is large enough to feel.
Ultrasound sends high-frequency sound waves (typically 5–18 MHz for breast imaging) into the tissue from a transducer and listens for the echoes. Sound reflects wherever it crosses a boundary between tissues with different acoustic impedance — the fat/gland boundary, the edge of a mass, a duct wall. The transducer measures how long each echo takes to come back (time-of-flight gives depth, since the speed of sound in soft tissue is roughly constant at ~1540 m/s) and how strong it is (brightness), and building up one scan line per transducer element gives the familiar grayscale B-mode image. Unlike mammography, ultrasound produces no ionizing radiation, so it’s used freely and repeatedly, including during pregnancy. It is comparatively poor at picking up microcalcifications, but very good at something mammography fundamentally cannot do at all: telling a fluid-filled cyst from a solid mass. A cyst transmits sound with almost no attenuation (posterior acoustic enhancement — everything behind it looks brighter), while a solid mass attenuates and scatters sound in ways that depend on its internal structure. That one distinction resolves a huge fraction of what would otherwise be ambiguous findings on a mammogram.
3. Why breast density makes this more than an academic distinction
Whether mammography or ultrasound “wins” for a given patient largely comes down to breast density — the ratio of glandular/fibrous tissue to fat, which the American College of Radiology grades A (almost entirely fatty) through D (extremely dense). Dense tissue and tumors are both radiographically dense, so a tumor sitting in dense tissue can be almost invisible on a mammogram — masked by the surrounding tissue rather than standing out against fat.
This isn’t a small effect. A widely cited screening study of nearly 28,000 examinations found mammography’s sensitivity dropped as low as the 30–48% range in women with extremely dense breasts, compared to consistently high sensitivity in fatty breasts [1]. A 2020 systematic review and meta-analysis across 21 studies found pooled sensitivity of 74% for mammography alone in dense breasts, rising to 96% when ultrasound was added — at some cost to specificity, since ultrasound also flags more benign findings that then need to be worked up [2]. That trade-off is exactly why ultrasound today is used as a supplement to mammography in dense breasts, not a replacement: mammography for microcalcifications and overall coverage, ultrasound for masses that mammography’s own physics makes hard to see.
4. From handheld ultrasound to 3D ABUS
Ordinary breast ultrasound is done with a handheld transducer swept over the breast by a sonographer in real time. It works, but it has two structural problems that have nothing to do with the physics above. First, it’s operator-dependent — the diagnostic quality of the exam depends on the skill and attention of whoever is holding the probe that day, at that moment, which makes it hard to standardize across sites or even across visits with the same patient. Second, a live 2D sweep is a poor thing to review later: the sonographer sees the full breast during the scan, but what gets saved are a handful of static frames, not the whole volume. A second radiologist reading those frames afterward is working with far less information than the person who did the scan.
Automated 3D breast ultrasound (ABUS) — the imaging technique this project’s dataset uses — fixes both problems by automating the acquisition. A wide transducer mechanically sweeps across the whole breast in one motion, and the machine assembles the individual 2D slices into a single 3D volume, typically covering the breast in a few overlapping passes per side. Because the sweep itself is mechanical rather than hand-guided, every scan of every patient is acquired the same way, and — critically — the entire volume is saved, not just a few chosen frames. A radiologist reviewing an ABUS study afterward can scroll through it slice by slice in any of three standard planes (transversal, coronal, sagittal) at their own pace, the same way they’d review a CT or MRI, rather than depending on what a sonographer happened to capture live. Reviews of the technique report excellent agreement between different readers of the same ABUS volume, which is exactly the reproducibility handheld ultrasound struggles with [3].
The image below is one transversal slice through an ABUS volume from the TDSC-ABUS dataset this project uses — the same kind of slice a radiologist would scroll through, at a physical millimetre scale rather than raw pixels (ABUS voxels are not cubes, which turns out to matter a lot once you start measuring shape — more on that in a later post).
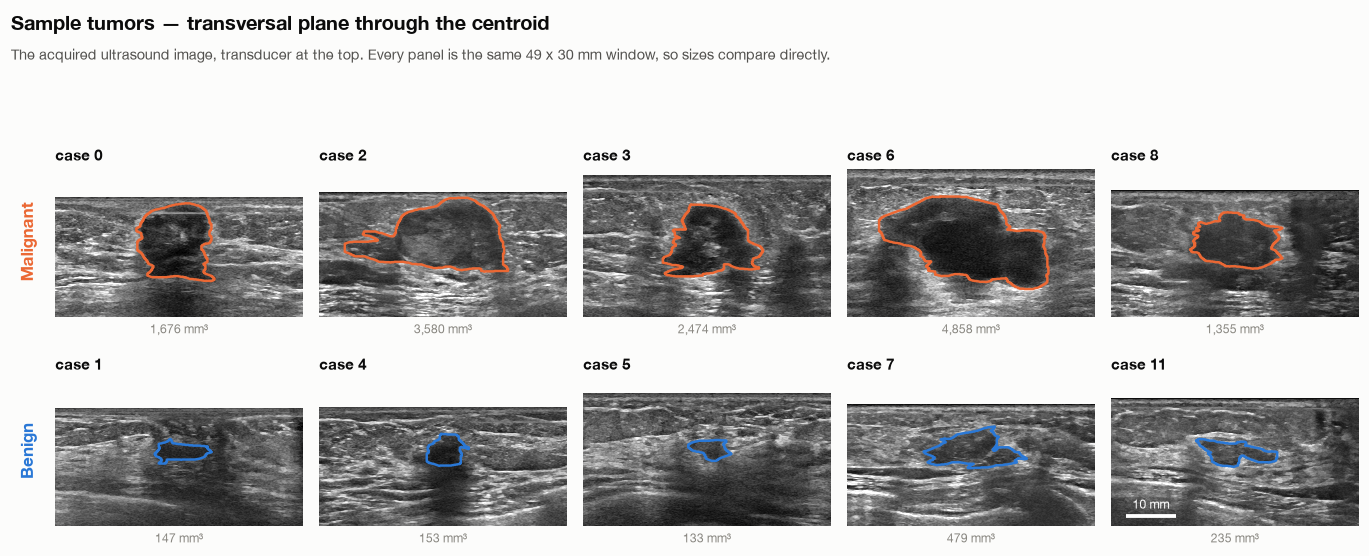
Five malignant and five benign lesions from the TDSC-ABUS dataset, each shown in the transversal plane through its centre at a common millimetre scale.
The coronal plane — the one roughly parallel to the chest wall, which a handheld scan essentially never captures — turns out to be particularly informative for malignancy, since it’s the plane in which spiculation (cancer’s characteristic radiating, starburst pattern) is most visible. That’s a recurring theme in the next post: several of the strongest classical features for this problem only exist because ABUS gives you a plane handheld ultrasound doesn’t.
The other side of automating the acquisition is that reading a full 3D volume, slice by slice, takes a radiologist considerably longer than glancing at a couple of 2D frames — which is the actual motivation for this whole project. If the volume is standardized and complete, it becomes something a model can be trained on, not just something a person has to scroll through. That’s where the rest of this series goes: turning what a radiologist looks for in a volume like the one above — shape, margins, spiculation, texture — into features and models that can flag and classify a lesion automatically.
References
- T. M. Kolb, J. Lichy, J. H. Newhouse. Comparison of the performance of screening mammography, physical examination, and breast US and evaluation of factors that influence them: an analysis of 27,825 patient evaluations. Radiology 225(1):165–175, 2002. doi:10.1148/radiol.2251011667
- W.-H. Yuan, H.-C. Hsu, Y.-Y. Chen, C.-H. Wu. Supplemental breast cancer-screening ultrasonography in women with dense breasts: a systematic review and meta-analysis. British Journal of Cancer 123:673–688, 2020. doi:10.1038/s41416-020-0928-1
- J. C. M. van Zelst, R. M. Mann. Automated three-dimensional breast US for screening: technique, artifacts, and lesion characterization. RadioGraphics 38(3):663–683, 2018. doi:10.1148/rg.2018170162
- R. F. Brem, L. Tabár, S. W. Duffy, et al. Assessing improvement in detection of breast cancer with three-dimensional automated breast US in women with dense breast tissue: the SomoInsight study. Radiology 274(3):663–673, 2015. doi:10.1148/radiol.14132832
Comment Channel